https://github.com/dylanwal/well_plate
well plates
https://github.com/dylanwal/well_plate
Last synced: over 1 year ago
JSON representation
well plates
- Host: GitHub
- URL: https://github.com/dylanwal/well_plate
- Owner: dylanwal
- License: bsd-3-clause
- Created: 2022-04-22T17:22:13.000Z (over 4 years ago)
- Default Branch: master
- Last Pushed: 2024-07-18T13:57:00.000Z (about 2 years ago)
- Last Synced: 2025-02-28T03:41:56.380Z (over 1 year ago)
- Language: Python
- Size: 58.6 KB
- Stars: 1
- Watchers: 1
- Forks: 1
- Open Issues: 0
-
Metadata Files:
- Readme: README.md
- License: LICENSE.txt
Awesome Lists containing this project
README
# Well Plate (well_plate)
---
---



Makes nice visualizations of well plates!
---
## Installation
```
pip install well_plate
```
## Dependencies
[numpy](https://github.com/numpy/numpy)
[pandas](https://github.com/pandas-dev/pandas)
[plotly](https://github.com/plotly/plotly.py)
---
---
## Options
* Well numbers
* 6
* 12
* 24
* 96
* 384
* To add more see [well_plate/config.py](https://github.com/dylanwal/well_plate/blob/master/well_plate/config.py)
* Well shape
* 'circle'
* 'rect' (square)
* Add data
* use `wp.add_data()`; pass in a pd.Series with the index corresponding to well plate index (eg. "A1", "E4", ...)
---
---
## Example
### Basic example
```python
import well_plate
wp = well_plate.WellPlate(24)
wp.plot()
```

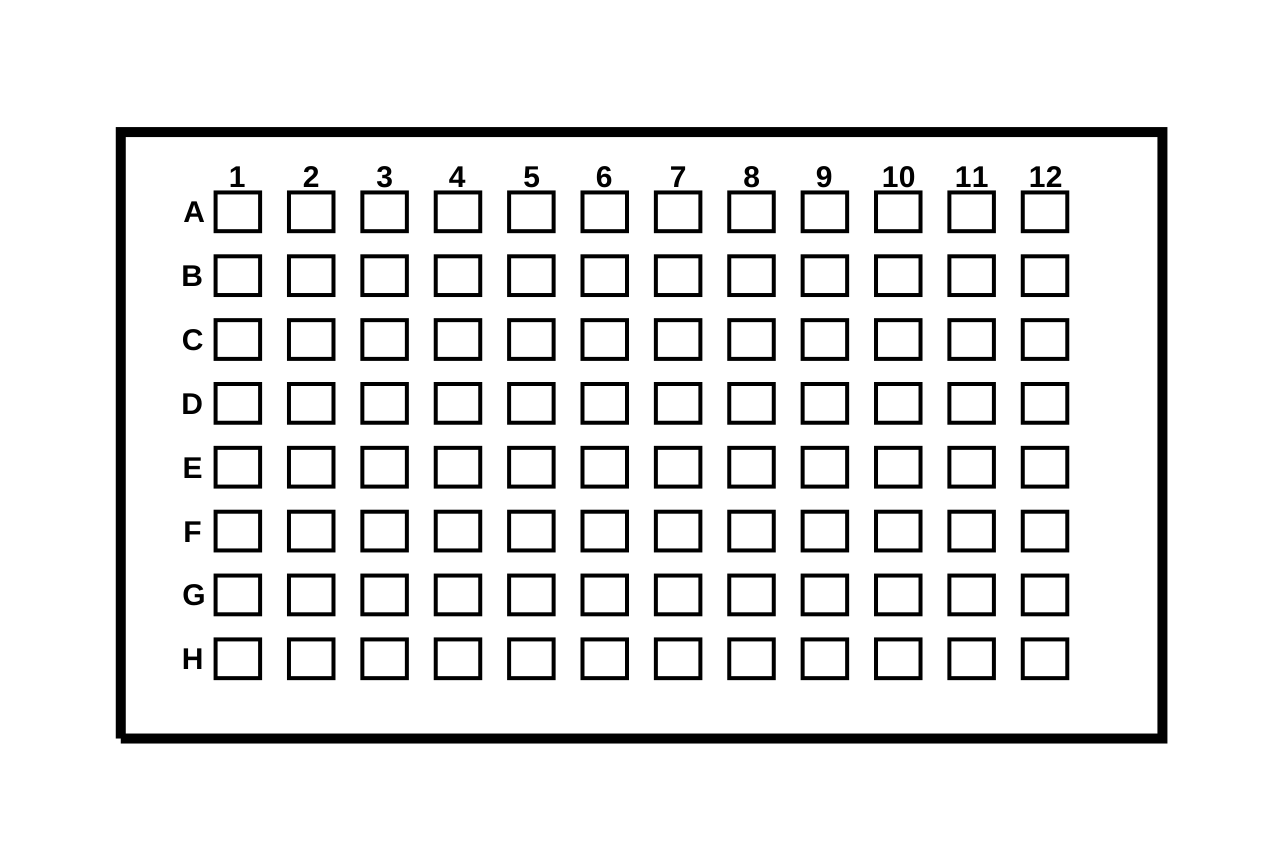
### Change well size
```python
import well_plate
wp = well_plate.WellPlate(96, "rect")
wp.plot()
```
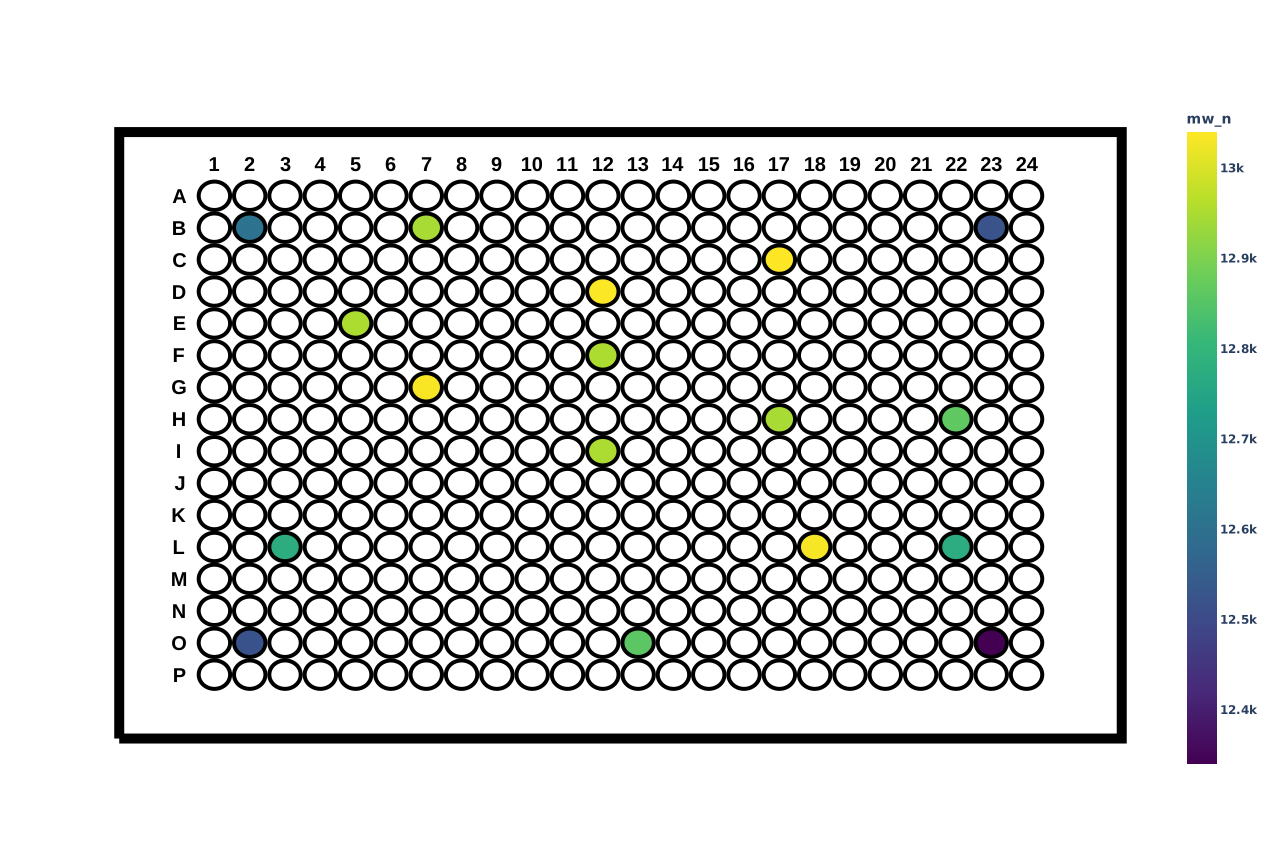
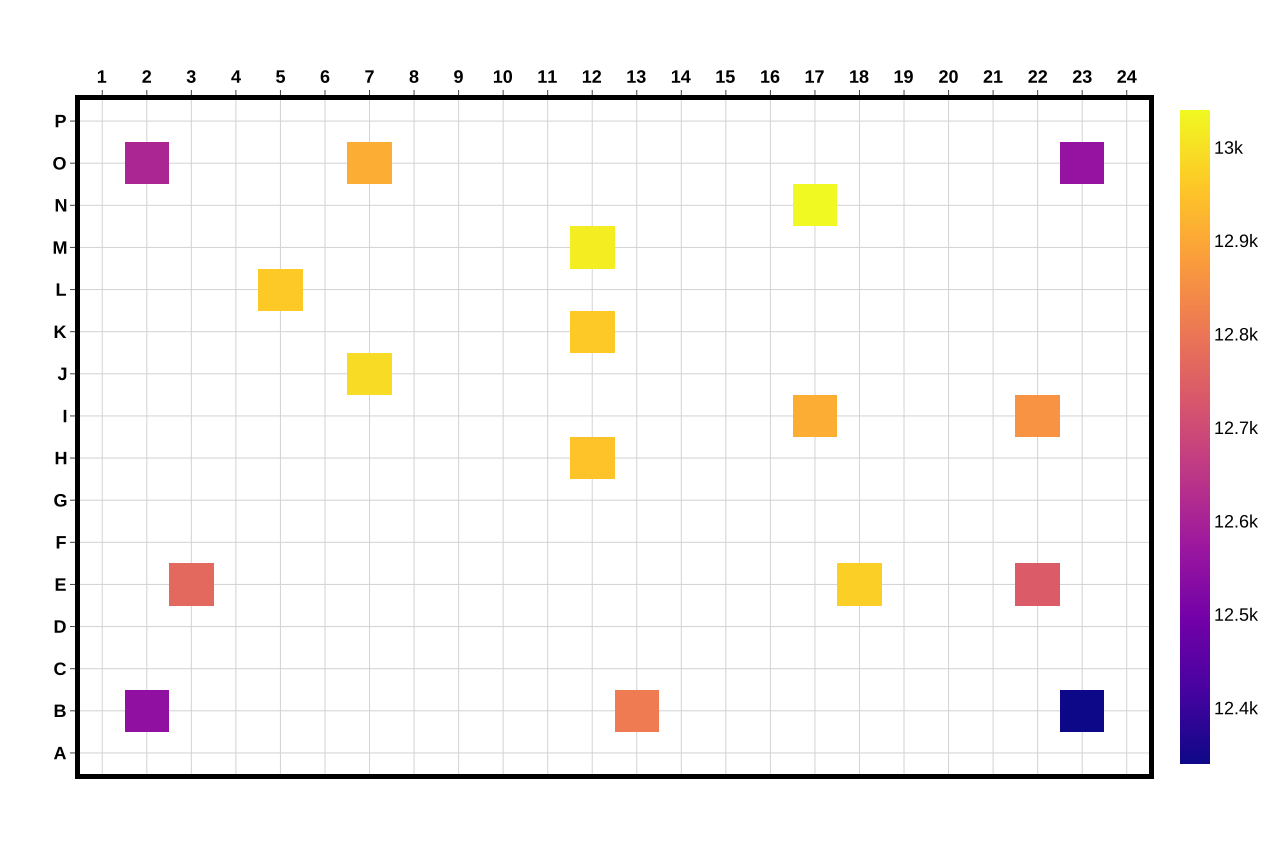
# Add data
```python
import pandas as pd
import well_plate
wp = well_plate.WellPlate(384, "rect")
df = pd.read_csv("example1_data.csv", index_col=0)
wp.add_data(df["mw_n"])
wp.plot(key="mw_n")
wp.heatmap(key="mw_n")
```