https://github.com/isikdogan/rivamap
an automated river analysis and mapping engine
https://github.com/isikdogan/rivamap
automated-river-analysis mapping river river-networks
Last synced: 11 months ago
JSON representation
an automated river analysis and mapping engine
- Host: GitHub
- URL: https://github.com/isikdogan/rivamap
- Owner: isikdogan
- Created: 2015-10-06T18:35:53.000Z (over 10 years ago)
- Default Branch: master
- Last Pushed: 2024-10-17T15:13:42.000Z (over 1 year ago)
- Last Synced: 2025-07-09T00:04:33.522Z (11 months ago)
- Topics: automated-river-analysis, mapping, river, river-networks
- Language: Python
- Homepage:
- Size: 86.9 KB
- Stars: 75
- Watchers: 14
- Forks: 33
- Open Issues: 4
-
Metadata Files:
- Readme: README.md
Awesome Lists containing this project
- open-sustainable-technology - rivamap - An Automated River Analysis and Mapping Engine. (Natural Resources / Water Supply and Quality)
README
# RivaMap: An Automated River Analysis and Mapping Engine
[](https://travis-ci.com/elbeejay/rivamap) [](https://coveralls.io/github/elbeejay/rivamap?branch=master)
## Related papers
* F. Isikdogan, A.C. Bovik, and P. Passalacqua, "RivaMap: an automated river analysis and mapping engine," *Remote Sensing of Environment, Special Issue on Big Remotely Sensed Data*, 2017. [[**Read at ScienceDirect**]](http://www.sciencedirect.com/science/article/pii/S0034425717301475), [[**PDF**]](http://www.isikdogan.com/files/isikdogan2017_rivamap.pdf)
* F. Isikdogan, A.C. Bovik, and P. Passalacqua, "Automatic channel network extraction from remotely sensed images by singularity analysis," *IEEE Geoscience and Remote Sensing Letters*, 12, 11, 2218-2221, 2015. [[**Read at IEEExplore**]](http://ieeexplore.ieee.org/xpl/articleDetails.jsp?arnumber=7192616), [[**PDF**]](http://live.ece.utexas.edu/publications/2015/Isikdogan_GRSL_2015_Channel_Network_Extraction.pdf)
## Dependencies and Installation
**Dependencies:**
* OpenCV 2.4
* Python 3.x
* Numpy
* Scipy
* Matplotlib
* GDAL
* pyshp
**Installing from PyPI:**
$ sudo pip install rivamap
**Installing from GitHub:**
$ git clone https://github.com/isikdogan/rivamap.git
$ sudo python setup.py install
**Example Use:**
See [example.ipynb](./examples/example.ipynb)
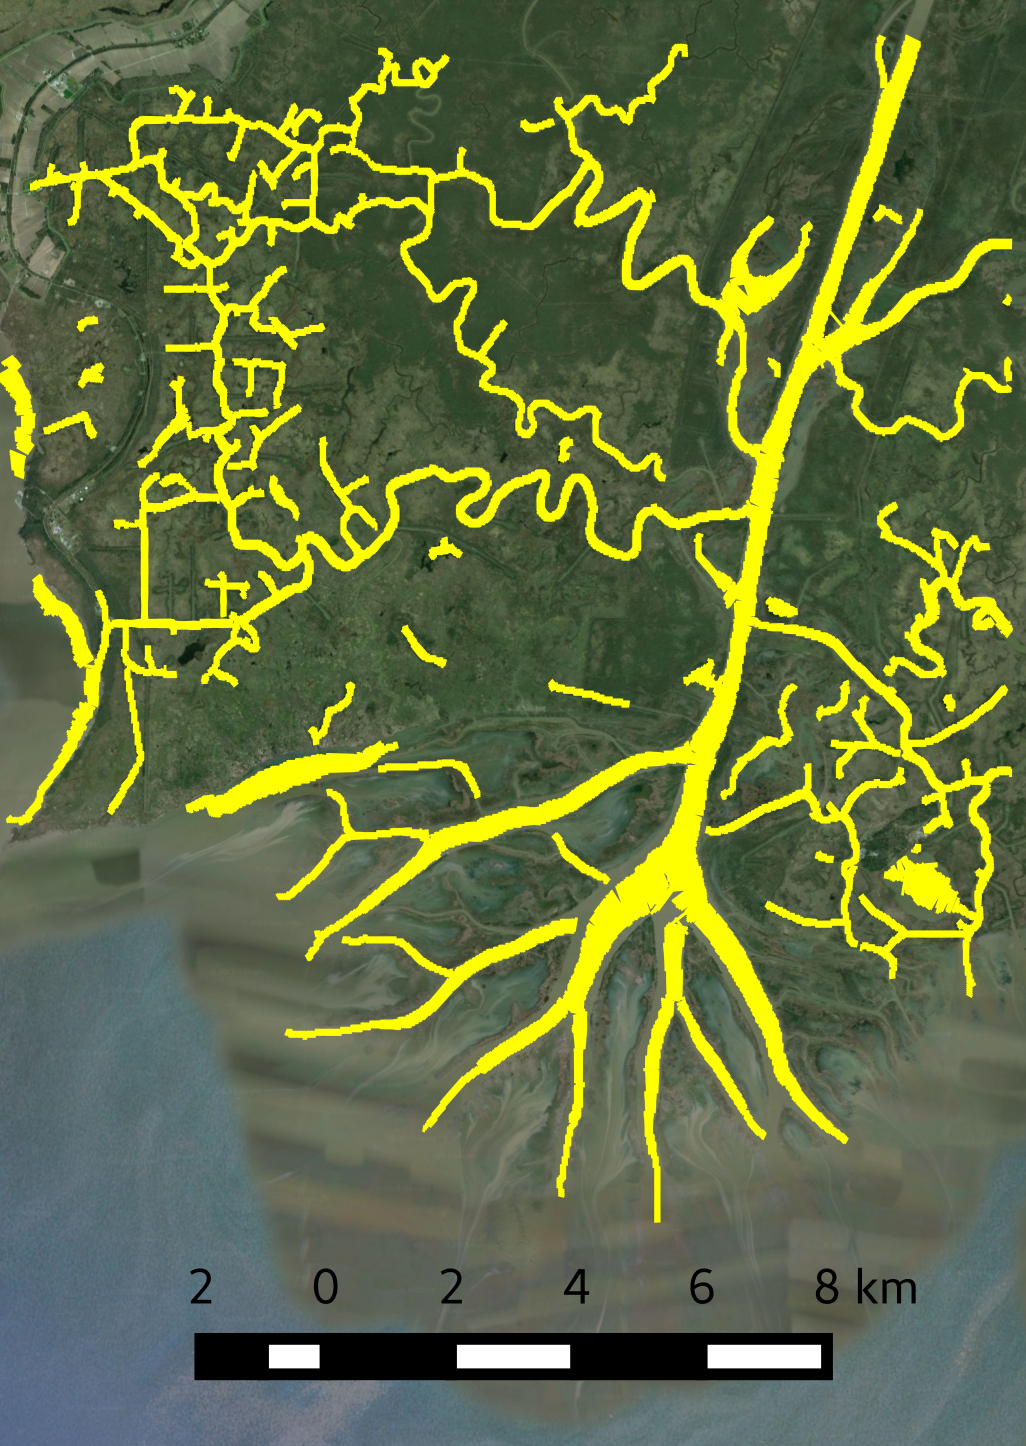
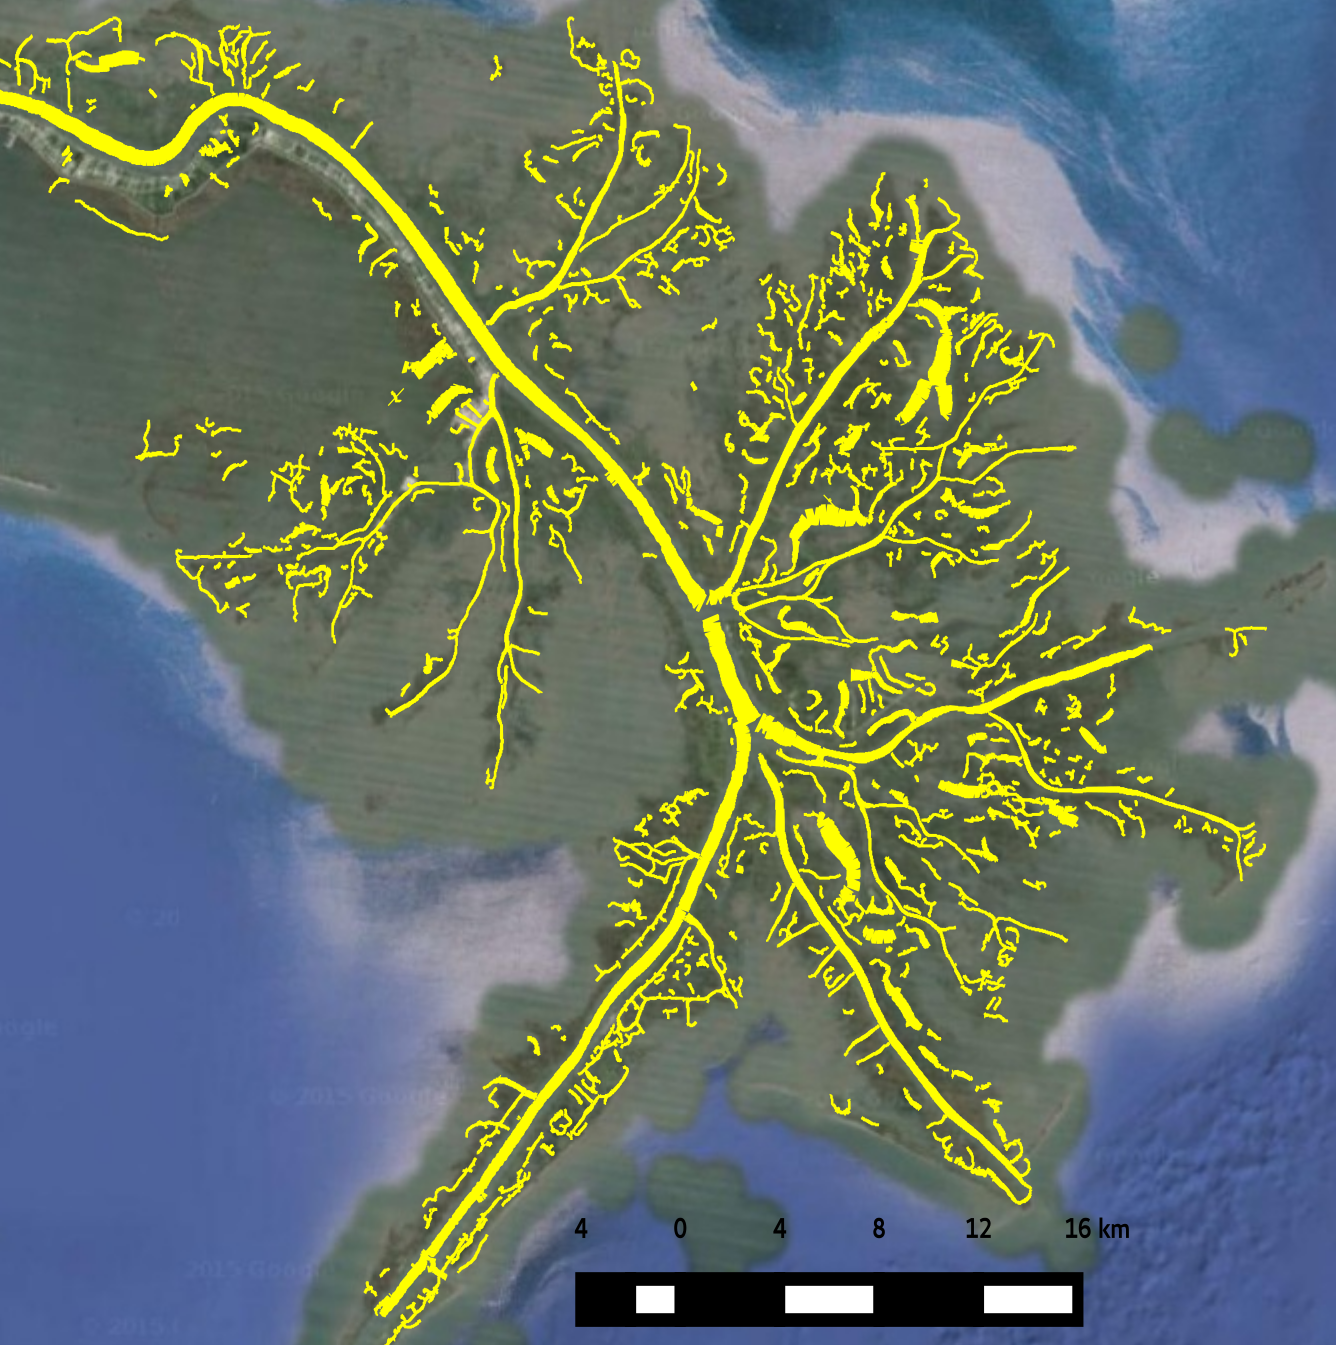
## Example Results


## Reference
Function
Description
preprocess.mndwi
Computes the modified normalized difference water index.
Inputs:
green: green band (e.g. Landsat 8 band 3)
mir: middle infrared band (e.g. Landsat 8 band 6)
Returns:
mndwi: mndwi response
preprocess.contrastStretch
Applies contrast stretch to an input image. Inputs and outputs an image.
preprocess.im2double
Converts image datatype to float. Inputs and outputs an image.
preprocess.double2im
Converts double data array to image. Inputs and outputs an image.
singularity_index.SingularityIndexFilters
Creates the filters that are needed for computing the modified multiscale singularity index response. The filters can be used for processing many input images once the filters are created.
Keyword arguments:
minScale: minimum scale sigma (default 1.2 pixels)
nrScales: number of scales (default 15)
singularity_index.applyMMSI
Applies the filters to a given input image to compute the modified multiscale singularity index response. Estimates the width and the dominant orientation angle for each spatial location.
Inputs:
I1: input image (e.g. Landsat NIR band or MNDWI)
filters: an instance of SingularityIndexFilters class that contains precomputed filters
togglePolarity: changes polarity, use if the rivers are darker than land in the input image (i.e. SAR images)
Returns:
psi: the singularity index response
widthMap: estimated width at each spatial location (x,y)
orient: local orientation at each spatial location (x,y)
delineate.extractCenterlines
Uses the previously computed singularity index response (psi) and the dominant orientation (orient) to extract centerlines.
Inputs: (can be obtained by running applyMMSI function)
psi: the singularity index response
orient: local orientation at each spatial location (x,y)
Returns:
nms: Non-maxima suppressed singularity index response (centerlines)
delineate.thresholdCenterlines
Uses a continuity-preserving hysteresis thresholding to classify centerlines.
Inputs:
nms: Non-maxima suppressed singularity index response
Keyword Arguments:
bimodal: true if the areas of rivers in the image are sufficiently large that the distribution of psi is bimodal
tLow: lower threshold (automatically set if bimodal=True)
tHigh: higher threshold (automatically set if bimodal=True)
Returns:
centerlines: a binary matrix that indicates centerline locations
georef.loadGeoMetadata
Reads metadata from a GeoTIFF file.
Inputs:
filepath: the path to the file
Returns:
gm: metadata
georef.saveAsGeoTiff
Saves a raster image as a GeoTIFF file
Inputs:
gm: georeferencing metadata
I: raster image
filepath: save destination
georef.pix2lonlat
Convers pixel coordinates into longitude and latitude.
Inputs:
gm: georeferencing metadata
x, y: pixel coordinates
Returns:
lon, lat: longitude and latitude
georef.lonlat2pix
Convers longitude and latitude into pixel coordinates.
Inputs:
gm: georeferencing metadata
lon, lat: longitude and latitude
Returns:
x, y: pixel coordinates
georef.exportCSVfile
Exports (coordinate, width) pairs to a comma separated text file.
Inputs:
centerlines: a binary matrix that indicates centerline locations
widthMap: estimated width at each spatial location (x,y)
gm: georeferencing metadata filepath: the path to the file
georef.exportShapeFile [NEW]
Exports line segments to a ShapeFile.
Inputs:
centerlines: a binary matrix that indicates centerline locations
widthMap: estimated width at each spatial location (x,y)
gm: georeferencing metadata filepath: the path to the file
visualization.generateRasterMap
Generates a raster map of channels. It draws a line of length w(x, y) and orientation θ(x, y) at each spatial location.
Inputs:
centerlines: a binary matrix that indicates centerline locations
orient: local orientation at each spatial location (x,y)
widthMap: estimated width at each spatial location (x,y)
Keyword Arguments:
thickness: thickness of the lines (default 3)
Returns:
raster: the raster map
visualization.generateVectorMap
Generates a vector map of channels. It draws a line of length w(x, y) and orientation θ(x, y) at each spatial location.
Inputs:
centerlines: a binary matrix that indicates centerline locations
orient: local orientation at each spatial location (x,y)
widthMap: estimated width at each spatial location (x,y)
saveDest: output figure save destination
Keyword Arguments:
thickness: thickness of the lines (default 0.2)
Returns:
None (saves the figure at saveDest)
visualization.quiverPlot
Generates a quiver plot that shows channel orientation and singularity index response strength.
Inputs:
psi: singularity index response
orient: local orientation at each spatial location (x,y)
saveDest: output figure save destination
Returns:
None (saves the figure at saveDest)