https://github.com/nafisalawalidris/machine-learning-with-python
Machine Learning with Python final project: Apply ML algorithms to solve real-world problem. Hands-on experience in data preprocessing, model selection, evaluation. Showcase ML proficiency in Python.
https://github.com/nafisalawalidris/machine-learning-with-python
classification data-science hierarchical-clustering machine-learning regression scikit-learn-python scipy
Last synced: 2 months ago
JSON representation
Machine Learning with Python final project: Apply ML algorithms to solve real-world problem. Hands-on experience in data preprocessing, model selection, evaluation. Showcase ML proficiency in Python.
- Host: GitHub
- URL: https://github.com/nafisalawalidris/machine-learning-with-python
- Owner: nafisalawalidris
- Created: 2023-05-22T01:05:55.000Z (about 3 years ago)
- Default Branch: main
- Last Pushed: 2023-05-23T23:52:53.000Z (about 3 years ago)
- Last Synced: 2025-01-23T07:12:13.715Z (over 1 year ago)
- Topics: classification, data-science, hierarchical-clustering, machine-learning, regression, scikit-learn-python, scipy
- Language: Jupyter Notebook
- Homepage:
- Size: 745 KB
- Stars: 1
- Watchers: 1
- Forks: 0
- Open Issues: 0
-
Metadata Files:
- Readme: README.md
Awesome Lists containing this project
README
# Machine-Learning-with-Python
# Simple Linear Regression
## Objectives
* Use scikit-learn to implement simple Linear Regression
* Create a model, train it, test it and use the model
# K-Nearest Neighbors
## Objectives
* Use K Nearest neighbors to classify data
In this Lab you will load a customer dataset, fit the data, and use K-Nearest Neighbors to predict a data point. But what is **K-Nearest Neighbors**?
**K-Nearest Neighbors** is a supervised learning algorithm. Where the data is 'trained' with data points corresponding to their classification. To predict the class of a given data point, it takes into account the classes of the 'K' nearest data points and chooses the class in which the majority of the 'K' nearest data points belong to as the predicted class.
### Here's an visualization of the K-Nearest Neighbors algorithm.

In this case, we have data points of Class A and B. We want to predict what the star (test data point) is. If we consider a k value of 3 (3 nearest data points), we will obtain a prediction of Class B. Yet if we consider a k value of 6, we will obtain a prediction of Class A.
In this sense, it is important to consider the value of k. Hopefully from this diagram, you should get a sense of what the K-Nearest Neighbors algorithm is. It considers the 'K' Nearest Neighbors (data points) when it predicts the classification of the test point.
Table of contents
# Decision Trees
## Objectives
* Develop a classification model using Decision Tree Algorithm
In this lab exercise, a popular machine learning algorithm, Decision Trees. You will use this classification algorithm to build a model from the historical data of patients, and their response to different medications. Then you will use the trained decision tree to predict the class of an unknown patient, or to find a proper drug for a new patient.
Table of contents
- About the dataset
- Downloading the Data
- Pre-processing
- Setting up the Decision Tree
- Modeling
- Prediction
- Evaluation
- Visualization
# **Regression Trees**
How to implement regression trees using ScikitLearn. Will show what parameters are important, how to train a regression tree, and finally how to determine our regression trees accuracy.
## Objectives
* Train a Regression Tree
* Evaluate a Regression Trees Performance
# **Taxi Tip Prediction using Scikit-Learn and Snap ML**
In this exercise session I consolidate the machine learning (ML) modeling skills by using a popular regression model: Decision Tree. Use a real dataset to train such a model. The dataset includes information about taxi tip and was collected and provided to the NYC Taxi and Limousine Commission (TLC) by technology providers authorized under the Taxicab & Livery Passenger Enhancement Programs (TPEP/LPEP). Use the trained model to predict the amount of tip paid.
In the current exercise session, will practice not only the Scikit-Learn Python interface, but also the Python API offered by the Snap Machine Learning (Snap ML) library. Snap ML is a high-performance IBM library for ML modeling. It provides highly-efficient CPU/GPU implementations of linear models and tree-based models. Snap ML not only accelerates ML algorithms through system awareness, but it also offers novel ML algorithms with best-in-class accuracy. For more information, please visit [snapml](https://ibm.biz/BdPfxy?utm_medium=Exinfluencer&utm_source=Exinfluencer&utm_content=000026UJ&utm_term=10006555&utm_id=NA-SkillsNetwork-Channel-SkillsNetworkCoursesIBMDeveloperSkillsNetworkML0101ENSkillsNetwork1047-2022-01-01) information page.
## Table of Contents
- Introduction
- Import Libraries
- Dataset Analysis
- Dataset Preprocessing
- Dataset Train/Test Split
- Build a Decision Tree Regressor model with Scikit-Learn
- Build a Decision Tree Regressor model with Snap ML
- Evaluate the Scikit-Learn and Snap ML Decision Tree Regressors
Introduction
The dataset used in this exercise session is publicly available here: https://www1.nyc.gov/site/tlc/about/tlc-trip-record-data.page (all rights reserved by Taxi & Limousine Commission(TLC), City of New York). The TLC Yellow Taxi Trip Records of June, 2019 are used in this notebook. The prediction of the tip amount can be modeled as a regression problem. To train the model you can use part of the input dataset and the remaining data can be used to assess the quality of the trained model. First, let's download the dataset.
# Logistic Regression with Python
## Objectives
* Use scikit Logistic Regression to classify
* Understand confusion matrix
In this notebook, will learn Logistic Regression, and then, create a model for a telecommunication company, to predict when its customers will leave for a competitor, so that they can take some action to retain the customers.
Table of contents
- About the dataset
- Data pre-processing and selection
- Modeling (Logistic Regression with Scikit-learn)
- Evaluation
- Practice
## What is the difference between Linear and Logistic Regression?
While Linear Regression is suited for estimating continuous values (e.g. estimating house price), it is not the best tool for predicting the class of an observed data point. In order to estimate the class of a data point, we need some sort of guidance on what would be the most probable class for that data point. For this, we use Logistic Regression.
Recall linear regression:
As you know, Linear regression finds a function that relates a continuous dependent variable, y, to some predictors (independent variables $x_1$, $x_2$, etc.). For example, simple linear regression assumes a function of the form:
$$
y = \theta_0 + \theta_1 x_1 + \theta_2 x_2 + \cdots
$$
and finds the values of parameters $\theta_0, \theta_1, \theta_2$, etc, where the term $\theta_0$ is the "intercept". It can be generally shown as:
$$
ℎ_\theta(𝑥) = \theta^TX
$$
Logistic Regression is a variation of Linear Regression, used when the observed dependent variable, y, is categorical. It produces a formula that predicts the probability of the class label as a function of the independent variables.
Logistic regression fits a special s-shaped curve by taking the linear regression function and transforming the numeric estimate into a probability with the following function, which is called the sigmoid function 𝜎:
$$
ℎ\_\theta(𝑥) = \sigma({\theta^TX}) = \frac {e^{(\theta\_0 + \theta\_1 x\_1 + \theta\_2 x\_2 +...)}}{1 + e^{(\theta\_0 + \theta\_1 x\_1 + \theta\_2 x\_2 +\cdots)}}
$$
Or:
$$
ProbabilityOfaClass\_1 = P(Y=1|X) = \sigma({\theta^TX}) = \frac{e^{\theta^TX}}{1+e^{\theta^TX}}
$$
In this equation, ${\theta^TX}$ is the regression result (the sum of the variables weighted by the coefficients), `exp` is the exponential function and $\sigma(\theta^TX)$ is the sigmoid or [logistic function](http://en.wikipedia.org/wiki/Logistic_function?utm_medium=Exinfluencer&utm_source=Exinfluencer&utm_content=000026UJ&utm_term=10006555&utm_id=NA-SkillsNetwork-Channel-SkillsNetworkCoursesIBMDeveloperSkillsNetworkML0101ENSkillsNetwork20718538-2021-01-01), also called logistic curve. It is a common "S" shape (sigmoid curve).
So, briefly, Logistic Regression passes the input through the logistic/sigmoid but then treats the result as a probability:
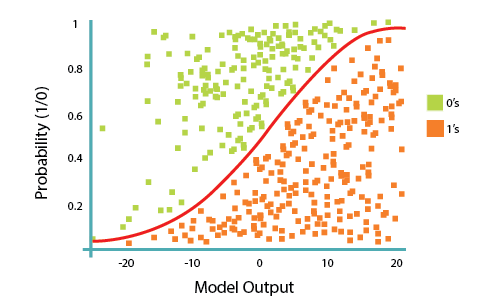
The objective of the **Logistic Regression** algorithm, is to find the best parameters θ, for $ℎ\_\theta(𝑥)$ = $\sigma({\theta^TX})$, in such a way that the model best predicts the class of each case.
### Customer churn with Logistic Regression
A telecommunications company is concerned about the number of customers leaving their land-line business for cable competitors. They need to understand who is leaving. Imagine that you are an analyst at this company and you have to find out who is leaving and why.
# SVM (Support Vector Machines)
## Objectives
* Use scikit-learn to Support Vector Machine to classify
In this notebook, will use SVM (Support Vector Machines) to build and train a model using human cell records, and classify cells to whether the samples are benign or malignant.
SVM works by mapping data to a high-dimensional feature space so that data points can be categorized, even when the data are not otherwise linearly separable. A separator between the categories is found, then the data is transformed in such a way that the separator could be drawn as a hyperplane. Following this, characteristics of new data can be used to predict the group to which a new record should belong.
Table of contents
# **Softmax Regression ,One-vs-All & One-vs-One for Multi-class Classification**
In this lab, how to convert a linear classifier into a multi-class classifier, including multinomial logistic regression or softmax regression, One vs. All (One-vs-Rest) and One vs. One
## **Objectives**
* Understand and apply some theory behind:
* Softmax regression
* One vs. All (One-vs-Rest)
* One vs. One
## **Introduction**
In Multi-class classification, we classify data into multiple class labels . Unlike classification trees and k-nearest neighbour, the concept of Multi-class classification for linear classifiers is not as straightforward. We can convert logistic regression to Multi-class classification using multinomial logistic regression or softmax regression; this is a generalization of logistic regression, this will not work for support vector machines. One vs. All (One-vs-Rest) and One vs. One are two other multi-class classification techniques can covert any two-class classifier to a multi-class classifier.