https://github.com/taosdata/grafanaplugin
TDengine datasource plugin for grafana
https://github.com/taosdata/grafanaplugin
Last synced: 3 months ago
JSON representation
TDengine datasource plugin for grafana
- Host: GitHub
- URL: https://github.com/taosdata/grafanaplugin
- Owner: taosdata
- License: agpl-3.0
- Created: 2020-02-29T03:14:02.000Z (over 6 years ago)
- Default Branch: master
- Last Pushed: 2026-02-24T12:16:22.000Z (4 months ago)
- Last Synced: 2026-02-24T17:24:57.338Z (4 months ago)
- Language: TypeScript
- Size: 38.2 MB
- Stars: 68
- Watchers: 25
- Forks: 30
- Open Issues: 18
-
Metadata Files:
- Readme: README.md
- Changelog: CHANGELOG.md
- Contributing: CONTRIBUTING.md
- License: LICENSE
Awesome Lists containing this project
README
# Grafana Plugin for TDengine
- [Grafana Plugin for TDengine](#grafana-plugin-for-tdengine)
- [Usage](#usage)
- [Add Data Source](#add-data-source)
- [Import Dashboard](#import-dashboard)
- [Important changes](#important-changes)
- [v3.6.0](#v360)
- [v3.2.0](#v320)
- [Monitor TDengine Database with TDinsight Dashboard](#monitor-tdengine-database-with-tdinsight-dashboard)
- [Docker Stack](#docker-stack)
- [Dashboards](#dashboards)
[TDengine] is open-sourced big data platform under GNU AGPL v3.0, designed and optimized for the Internet of Things (IoT), Connected Cars, Industrial IoT, and IT Infrastructure and Application Monitoring, developed by [TDengine](https://tdengine.com/).
[TDengine] data source plugin is developed for [Grafana]. This document explains how to install and configure the data source plugin, and use it as a time-series database. We'll take a look at the data source options, variables, querying, and other options specific to this data source.
At first, please refer to [Add a data source](https://grafana.com/docs/grafana/latest/datasources/add-a-data-source/) for instructions on how to add a data source to Grafana. Note that, only users with the organization admin role can add data sources.
To install this plugin, please refer to [Install the Grafana Plugin for TDengine](https://github.com/taosdata/grafanaplugin/blob/master/INSTALLATION.md)
## Usage
Now it's ready for you to add your own TDengine data source and use it in a dashboard. Refer to [Grafana Datasource documentations topic - Add a data source](https://grafana.com/docs/grafana/latest/datasources/add-a-data-source/) for a quick view. Please make sure the TDengine backend daemon `taosd` and TDengine RESTful service backend daemon `taosadapter` already launched.
### Add Data Source
Point to **Configurations** -> **Data Sources** menu and then **Add data source** button.

Search and choose **TDengine**.

If TDengine is not in the list, please check the installation instructions for allowing loading unsigned plugins.
**Configure TDengine data source for Grafana version 11.**
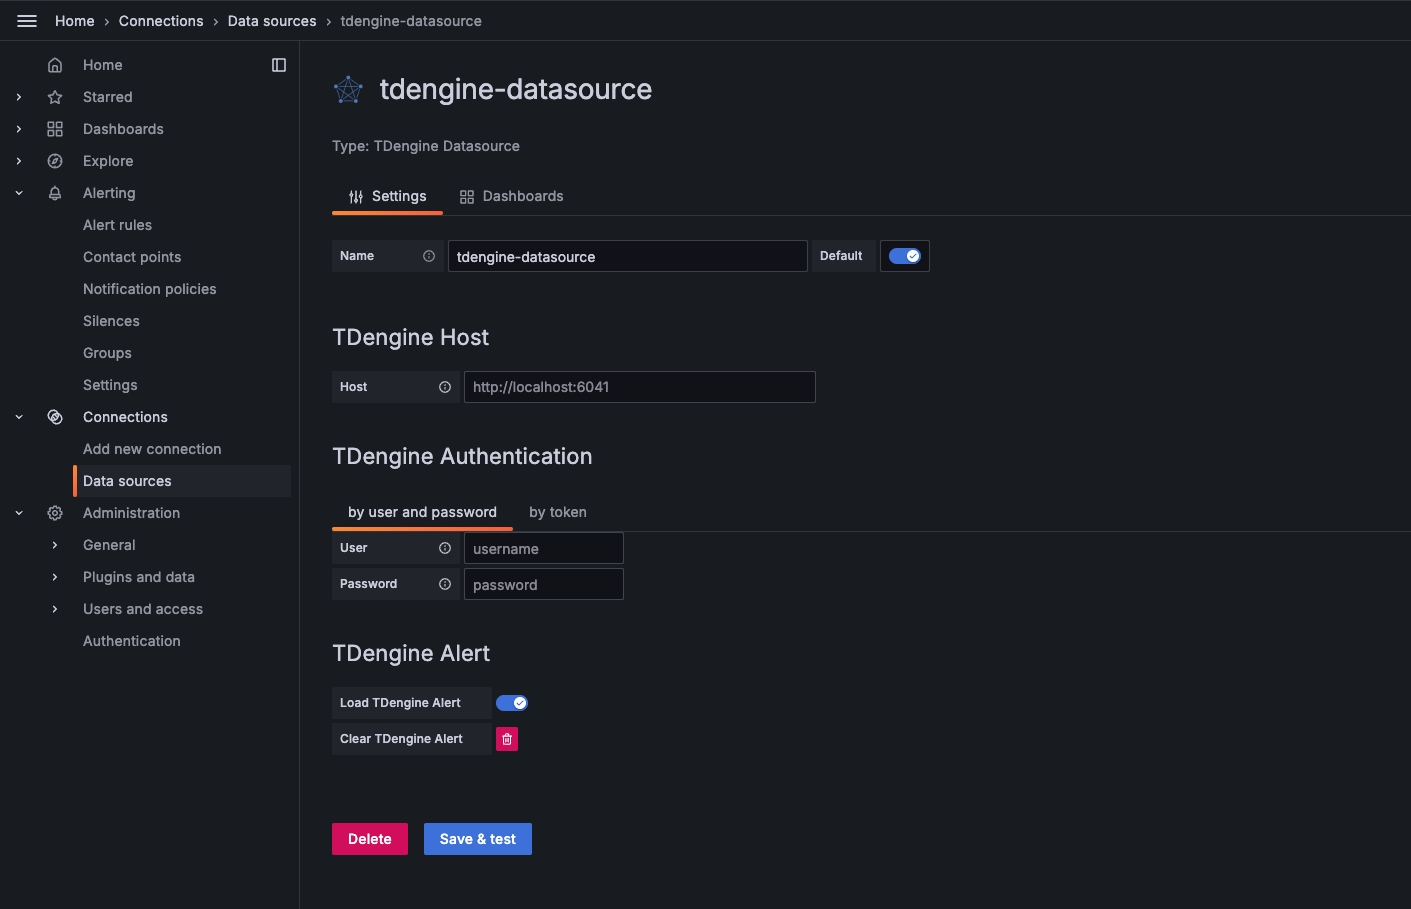
Note:
1. Close the Load TDengine Alert button to prevent automatic import of alert rules when adding data sources.
2. When deleting a data source, it is necessary to first clear the imported alert rules
**Configure TDengine data source for Grafana with version lower than 11.**

Save and test it, it should say 'TDengine Data source is working'.

### Import Dashboard
Point to **+** / **Create** - **import** (or `/assets/import` url).

Now you can import dashboard with JSON file or grafana dashboard id (please make sure your network is public to ).
Here is the first grafana dashboard you want to use for TDengine, the grafana dashboard id is [`18180`](https://grafana.com/grafana/dashboards/18180-tdinsight-for-3-x/).

After import:

## Important changes
### [v3.6.0](https://github.com/taosdata/grafanaplugin/releases/tag/v3.6.0)
1. Grafana 11 versions
The TDengine data source plugin has added functionality for Grafana 11 versions, which can automatically import and clear alerts for basic metrics of the TDengine cluster (such as CPU, memory, dnode, vnode, etc.) when adding data sources.

Note:
(1)Close the Load TDengine Alert button to prevent automatic import of alert rules when adding data sources.
(2)When deleting a data source, it is necessary to first clear the imported alarm rules.
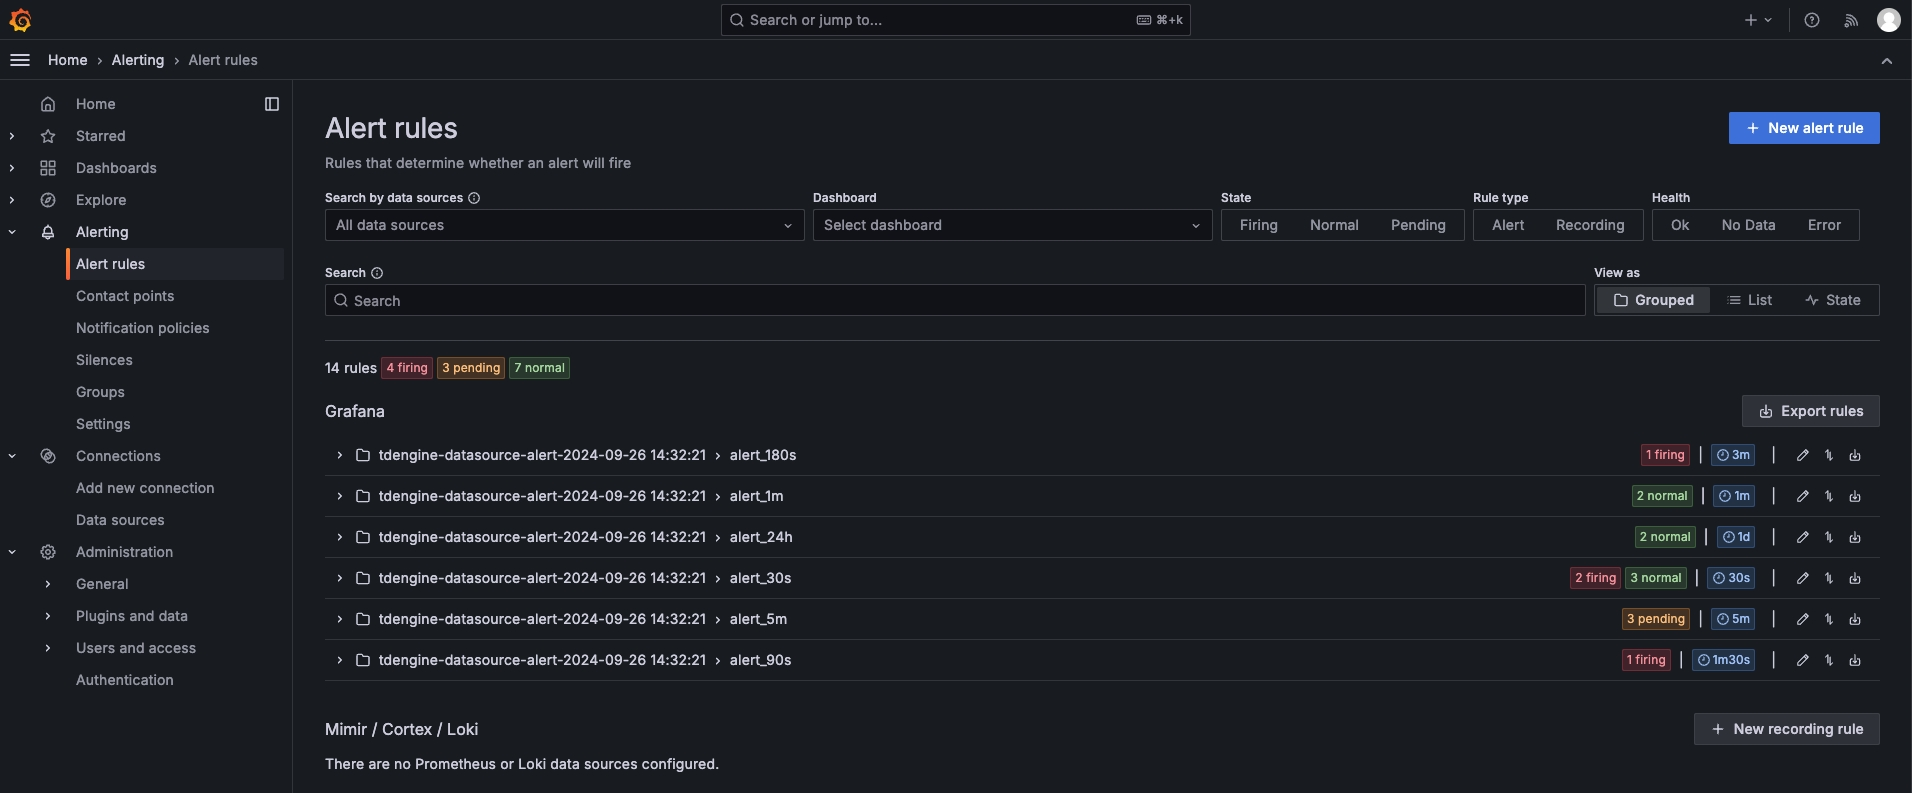
After adding the data source, you will see the automatically imported alert configuration in the alert management menu.
2. Grafana 8.0 versions
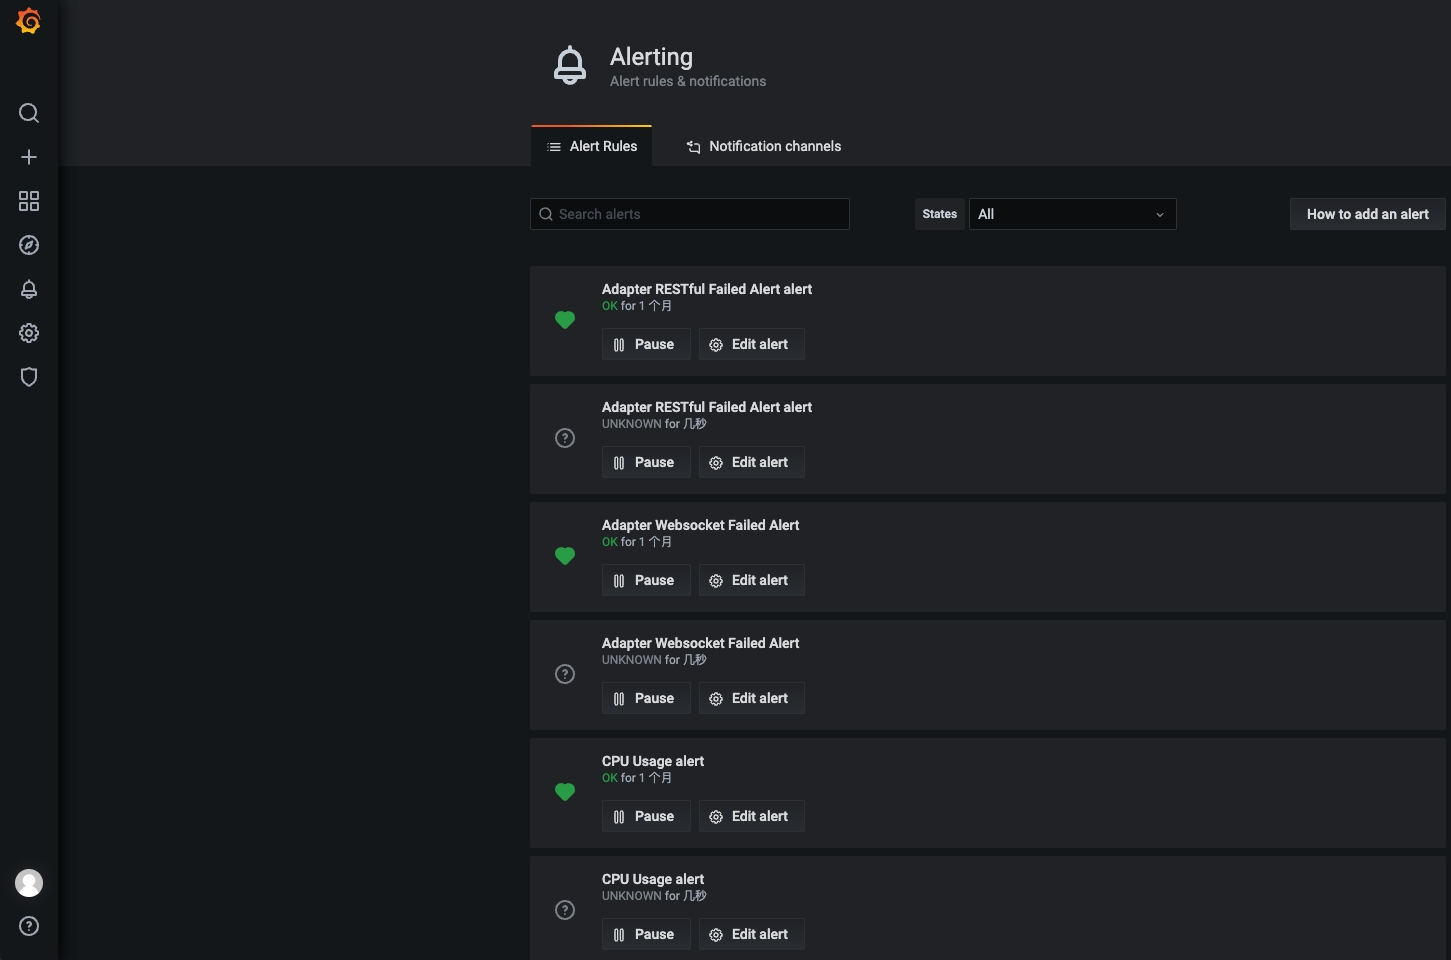
The TDengine data source plugin has added functionality for Grafana 8.0 versions, which can automatically import and clear alerts for basic metrics of the TDengine cluster (such as CPU, memory, dnode, vnode, etc.) when adding data sources.
To import the Dashboard, enter "TDinsight for 3.x Dashboard" and click save. Subsequently, the loaded alert rules will appear in the alert menu as shown below.
### [v3.2.0](https://github.com/taosdata/grafanaplugin/releases/tag/v3.2.0)
1. TDengine data source plugin uses secureJsonData to store sensitive data. It will cause a breaking change when you're upgrading from an older version:
The simple way to migrate from older version is to reconfigure the data source like adding a data source from scratch.
If you're using Grafana provisioning configurations, you should change the data source provisioning configuration file to use `secureJsonData`:
```yaml
apiVersion: 1
datasources:
# name of the datasource. Required
- name: TDengine
# datasource type. Required
type: tdengine-datasource
# access mode. direct or proxy. Required
# org id. will default to orgId 1 if not specified
orgId: 1
# url to TDengine rest api, eg. http://td1:6041
url: "$TDENGINE_API"
# mark as default datasource. Max one per org
isDefault: true
#
secureJsonData:
# a redundant url configuration. Required.
url: "$TDENGINE_API"
# basic authorization token. Required, can be build like
# `printf root:taosdata|base64`
basicAuth: "${TDENGINE_BASIC_AUTH}"
# cloud service token of TDengine, optional.
token: "$TDENGINE_CLOUD_TOKEN"
version: 1
# allow users to edit datasources from the UI.
editable: true
```
2. Now users can quickly import TDinsight dashboard in **Dashboards** tab in a datasource configuration page.

## Monitor TDengine Database with TDinsight Dashboard
TDinsight is a simple monitoring solution for TDengine database. See [TDinsight README](https://github.com/taosdata/grafanaplugin/blob/master/src/dashboards/TDinsightV3.md) for the details.
## Docker Stack
For a quick look and test, you can use `docker-compose` to start a full Grafana + AlertManager + Alert Webhook stack:
```sh
docker-compose up -d
```
Services:
- Grafana:
- AlertManager: , in docker it's
- Webhook: , in docker it's
## Dashboards
You can get other dashboards in the examples' directory, or search in grafana with TDengine datasource .
Here is a short list:
- [18180](https://grafana.com/grafana/dashboards/18180): TDinsightV3
- [15167](https://grafana.com/grafana/dashboards/15167): TDinsightV2
- [19910](https://grafana.com/grafana/dashboards/19910): TDsmeters
- [20631](https://grafana.com/grafana/dashboards/20631): taosX
You could open a pr to add one if you want to share your dashboard with TDengine community, we appreciate your contribution!
[TDengine]: https://github.com/taosdata/TDengine
[Grafana]: https://grafana.com