https://github.com/fortio/fortio
Fortio load testing library, command line tool, advanced echo server and web UI in go (golang). Allows to specify a set query-per-second load and record latency histograms and other useful stats.
https://github.com/fortio/fortio
go golang golang-application golang-library grpc http performance performance-testing performance-visualization proxy
Last synced: about 1 year ago
JSON representation
Fortio load testing library, command line tool, advanced echo server and web UI in go (golang). Allows to specify a set query-per-second load and record latency histograms and other useful stats.
- Host: GitHub
- URL: https://github.com/fortio/fortio
- Owner: fortio
- License: apache-2.0
- Created: 2017-10-10T01:01:39.000Z (almost 9 years ago)
- Default Branch: master
- Last Pushed: 2025-05-08T13:07:35.000Z (about 1 year ago)
- Last Synced: 2025-05-13T17:09:23.029Z (about 1 year ago)
- Topics: go, golang, golang-application, golang-library, grpc, http, performance, performance-testing, performance-visualization, proxy
- Language: Go
- Homepage: https://fortio.org
- Size: 2.71 MB
- Stars: 3,518
- Watchers: 51
- Forks: 260
- Open Issues: 82
-
Metadata Files:
- Readme: README.md
- Contributing: CONTRIBUTING.md
- License: LICENSE
- Security: SECURITY.md
Awesome Lists containing this project
- awesome-go-cn - fortio
- awesome-grpc - fortio - A microservices (http, grpc) load testing library and tool from Istio project. (Tools / Testing)
- awesome-go - fortio - Load testing library and command line tool, advanced echo server and web UI. Allows to specify a set query-per-second load and record latency histograms and other useful stats and graph them. Tcp, Http, gRPC. (Networking / Strings)
- awesome-go - fortio - Load testing library and command line tool, advanced echo server and web UI. Allows to specify a set query-per-second load and record latency histograms and other useful stats and graph them. Tcp, Http, gRPC. (Networking / Transliteration)
- awesome-go - fortio - Fortio load testing library, command line tool, advanced echo server and web UI in go (golang). Allows to specify a set query-per-second load and record latency histograms and other useful stats. - ★ 514 (Networking)
- awesome-go-cn - fortio
- awesome-go-info - fortio - per-second load and record latency histograms and other useful stats and graph them. Tcp, Http, gRPC. | (Relational Databases)
- awesome-Char - fortio - Load testing library and command line tool, advanced echo server and web UI. Allows to specify a set query-per-second load and record latency histograms and other useful stats and graph them. Tcp, Http, gRPC. (Networking / Uncategorized)
- awesome-go-zh - fortio
- fucking-awesome-go - fortio - Load testing library and command line tool, advanced echo server and web UI. Allows to specify a set query-per-second load and record latency histograms and other useful stats and graph them. Tcp, Http, gRPC. (Networking / Transliteration)
- awesome-go - fortio/fortio - per-second load and record latency histograms and other useful stats. ☆`3,648` (Networking / Transliteration)
- awesome-go-extra - fortio - per-second load and record latency histograms and other useful stats.|2645|208|78|2017-10-10T01:01:39Z|2022-08-24T13:35:27Z| (Networking / Uncategorized)
- awesome-starred - fortio/fortio - Fortio load testing library, command line tool, advanced echo server and web UI in go (golang). Allows to specify a set query-per-second load and record latency histograms and other useful stats. (golang)
- awesome-go - fortio - Load testing library and command line tool, advanced echo server and web UI. Allows to specify a set query-per-second load and record latency histograms and other useful stats and graph them. Tcp, Http, gRPC. Stars:`3.6K`. (Networking / Transliteration)
- awesome-go - fortio - Load testing library and command line tool, advanced echo server and web UI. Allows to specify a set query-per-second load and record latency histograms and other useful stats and graph them. Tcp, Http, gRPC. (Networking / Transliteration)
- awesome-go - fortio - Load testing library and command line tool, advanced echo server and web UI. Allows to specify a set query-per-second load and record latency histograms and other useful stats and graph them. Tcp, Http, gRPC. (Networking / Transliteration)
- awesome-go-plus - fortio - Load testing library and command line tool, advanced echo server and web UI. Allows to specify a set query-per-second load and record latency histograms and other useful stats and graph them. Tcp, Http, gRPC.  (Networking / Transliteration)
- go-awesome-with-star-updatetime - fortio - Load testing library and command line tool, advanced echo server and web UI. Allows to specify a set query-per-second load and record latency histograms and other useful stats and graph them. Tcp, Http, gRPC. (Networking / Uncategorized)
- awesome-go - fortio - per-second load and record latency histograms and other useful stats and graph them. Tcp, Http, gRPC. | - | - | - | (Networking / Strings)
- awesome - fortio - Fortio load testing library, command line tool, advanced echo server and web UI in go (golang). Allows to specify a set query-per-second load and record latency histograms and other useful stats. (Go)
- awesome-go - fortio - Load testing library and command line tool, advanced echo server and web UI. Allows to specify a set query-per-second load and record latency histograms and other useful stats and graph them. Tcp, Http, gRPC. (Networking / Strings)
- awesome-go-with-stars - fortio - per-second load and record latency histograms and other useful stats and graph them. Tcp, Http, gRPC. | 2026-06-11 | (Networking / Transliteration)
- zero-alloc-awesome-go - fortio - Load testing library and command line tool, advanced echo server and web UI. Allows to specify a set query-per-second load and record latency histograms and other useful stats and graph them. Tcp, Http, gRPC. (Networking / Transliteration)
- awesome-golang-repositories - fortio - per-second load and record latency histograms and other useful stats. (Repositories)
- awesome-go - fortio - Load testing library and command line tool, advanced echo server and web UI. Allows to specify a set query-per-second load and record latency histograms and other useful stats and graph them. Tcp, Http, gRPC. (Networking / Transliteration)
- awesome-go-cn - fortio
- awesome-go - fortio - Load testing library and command line tool, advanced echo server and web UI. Allows to specify a set query-per-second load and record latency histograms and other useful stats and graph them. Tcp, Http, gRPC. (Networking / Transliteration)
README
# Fortio
[](https://github.com/avelino/awesome-go#networking)
[](https://bestpractices.coreinfrastructure.org/projects/6054)
[](https://goreportcard.com/report/fortio.org/fortio)
[](https://godoc.org/fortio.org/fortio)
[](https://codecov.io/gh/fortio/fortio)
[](https://circleci.com/gh/fortio/fortio)
[](https://hub.docker.com/r/fortio/fortio)

Fortio (Φορτίο) started as, and is, [Istio](https://istio.io/)'s load testing tool and later (2018) graduated to be its own project.
Fortio runs at a specified query per second (qps) and records a histogram of execution time
and calculates percentiles (e.g., p99 i.e., the response time such as 99% of the requests take less than that number (in seconds, SI unit)).
It can run for a set duration, for a fixed number of calls, or until interrupted (at a constant target QPS, or max speed/load per connection/thread).
The name fortio comes from Greek [φορτίο](https://fortio.org/fortio.mp3) which means load/burden.
Fortio is a fast, small (less than 6Mb Docker image download, minimal dependencies), reusable, embeddable go library as well as a command line tool and server process,
the server includes a simple web UI and REST API to trigger run and see graphical representation of the results (both a single latency graph and a multiple results comparative min, max, avg, qps and percentiles graphs).
Fortio also includes a set of server side features (similar to httpbin) to help debugging and testing: request echo back including headers, adding latency or error codes with a probability distribution, TCP echoing, TCP proxying, HTTP fan out/scatter and gather proxy server, gRPC echo/health in addition to HTTP, etc...
Fortio is quite mature and very stable with no known major bugs (lots of possible improvements if you want to contribute though!),
and when bugs are found they are fixed quickly, so after 1 year of development and 42 incremental releases, we reached 1.0 in June 2018.
Fortio components can be used a library even for unrelated projects, for instance the `stats`, or `fhttp` utilities both client and server.
A recent addition is the new `jrpc` JSON Remote Procedure Calls library package ([docs](https://pkg.go.dev/fortio.org/fortio/jrpc)).
We also have moved some of the library to their own toplevel package, like:
- Dynamic flags: [fortio.org/dflag](https://github.com/fortio/dflag#fortio-dynamic-flags)
- Logger: [fortio.org/log](https://github.com/fortio/log#log) - now using structured JSON logs for servers (vs text for CLIs) since fortio 1.55 / log 1.4. In color since fortio 1.57 / log 1.6.
- Version helper: [fortio.org/version](https://github.com/fortio/version#version)
- CLI helpers integrating the above to reduce toil making new tools [fortio.org/cli](https://github.com/fortio/cli#cli) and servers [fortio.org/scli](https://github.com/fortio/scli#scli) for arguments, flags, usage, dynamic config, etc...
If you want to connect to fortio using HTTPS and fortio to provide real TLS certificates, or to multiplex gRPC and regular HTTP behind a single port, check out [Fortio Proxy](https://github.com/fortio/proxy#fortio-proxy).
If you want fortio to generate detailed Open Telemetry traces use [Fortiotel](https://github.com/fortio/fortiotel#fortiotel).
Fortio now embeds the [grol scripting language](https://grol.io/), available using `fortio script`.
## Installation
We publish a multi architecture Docker image (linux/amd64, linux/arm64, linux/ppc64le, linux/s390x) `fortio/fortio`.
For instance:
```shell
docker run -p 8080:8080 -p 8079:8079 fortio/fortio server & # For the server
docker run fortio/fortio load -logger-force-color http://www.google.com/ # For a test run, forcing color instead of JSON log output
```
You can install from source:
1. [Install go](https://golang.org/doc/install) (golang 1.18 or later)
2. `go install fortio.org/fortio@latest`
3. you can now run `fortio` (from your gopath bin/ directory, usually `~/go/bin`)
The [releases](https://github.com/fortio/fortio/releases) page has binaries for many OS/architecture combinations (see assets):
```shell
curl -L https://github.com/fortio/fortio/releases/download/v1.69.4/fortio-linux_amd64-1.69.4.tgz \
| sudo tar -C / -xvzpf -
# or the debian package
wget https://github.com/fortio/fortio/releases/download/v1.69.4/fortio_1.69.4_amd64.deb
dpkg -i fortio_1.69.4_amd64.deb
# or the rpm
rpm -i https://github.com/fortio/fortio/releases/download/v1.69.4/fortio-1.69.4-1.x86_64.rpm
# and more, see assets in release page
```
On macOS you can also install Fortio using [Homebrew](https://brew.sh/):
```shell
brew install fortio
```
On Windows, download https://github.com/fortio/fortio/releases/download/v1.69.4/fortio_win_1.69.4.zip and extract `fortio.exe` to any location, then using the Windows Command Prompt:
```
fortio.exe server
```
(at the prompt, allow the Windows firewall to let connections in)
Once `fortio server` is running, you can visit its web UI at [http://localhost:8080/fortio/](http://localhost:8080/fortio/)
You can get a preview of the reporting/graphing UI at [https://demo.fortio.org](https://demo.fortio.org)
## Command line arguments
Fortio can be a HTTP or gRPC load generator, gathering statistics using the `load` subcommand,
or start simple HTTP and gRPC ping servers, as well as a basic web UI, result graphing, TCP/UDP echo, proxies, https redirector,
with the `server` command or issue gRPC ping messages using the `grpcping` command.
It can also fetch a single URL's for debugging when using the `curl` command (or the `-curl` flag to the load command).
Likewise you can establish a single TCP (or Unix domain or UDP (use `udp://` prefix)) connection using the `nc` command (like the standalone netcat package).
You can run just the redirector with `redirect` or just the TCP echo with `tcp-echo`.
If you saved JSON results (using the web UI or directly from the command line), you can browse and graph those results using the `report` command.
You can run interactive fortio.load() scripts using `script` or already written [grol scripts](https://grol.io/), a simplified go like language, from a file, like
```
fortio script -init 'url="http://localhost:8080/"' scripting_example.gr
...
---- 🎉 Ramp up to 8000 qps done without error, actual qps 7993.678998 ----
---- 🎉 Ramp up to 9000 qps done without error, actual qps 8994.693886 ----
---- 🎉 Ramp up to 10000 qps done without error, actual qps 9996.013250 ----
```
See [scripting_example.gr](scripting_example.gr) or the tests in [cli_tests.txtar](cli_test.txtar).
The `version` command will print the short print version. `fortio buildinfo` will print the full
build information.
Lastly, you can learn which flags are available using `help` command.
Most important flags for HTTP load generation:
| Flag | Description, example |
| -------------|----------------------|
| `-qps rate` | Total Queries Per Seconds across all connections/threads or 0 for no wait/max qps |
| `-nocatchup` | Do not try to reach the target qps by going faster when the service falls behind and then recovers. Makes QPS an absolute ceiling even if the service has some spikes in latency, fortio will not compensate (but also won't stress the target more than the set qps). Recommended to use jointly with `-uniform`. |
| `-c connections` | Number of parallel simultaneous connections (and matching go routine) |
| `-t duration` | How long to run the test (for instance `-t 30m` for 30 minutes) or 0 to run until ^C, example (default 5s) |
| `-n numcalls` | Run for exactly this number of calls instead of duration. Default (0) is to use duration (-t). |
| `-payload str` or `-payload-file fname` | Switch to using POST with the given payload (see also `-payload-size` for random payload)|
| `-uniform` | Spread the calls in time across threads for a more uniform call distribution. Works even better in conjunction with `-nocatchup`. |
| `-r resolution` | Resolution of the histogram lowest buckets in seconds (default 0.001 i.e, 1ms), use 1/10th of your expected typical latency |
| `-H "header: value"` | Can be specified multiple times to add headers (including Host:) |
| `-a` | Automatically save JSON result with filename based on labels and timestamp |
| `-json filename` | Filename or `-` for stdout to output JSON result (relative to `-data-dir` by default, should end with .json if you want `fortio report` to show them; using `-a` is typically a better option)|
| `-labels "l1 l2 ..."` | Additional config data/labels to add to the resulting JSON, defaults to target URL and hostname|
| `-h2` | Client calls will attempt to negotiate HTTP/2 instead of HTTP/1.1, implies `-stdclient`|
| `-X method` | Change HTTP method to the one specified instead of automatic HTTP GET or POST based on `-payload-*` or `-content-type`|
| `-logger-force-color` | For interactive runs for color instead of JSON output|
| `-logger-no-color` | Force JSON output even when run from terminal|
Changing the HTTP options like the TLS options `-cert`, `-key`, `-cacert` when launching an echo/UI/rapi server will make these options the default for runs initiated from that server (or fetches/proxies etc.).
Full list of command line flags (`fortio help`):
Φορτίο 1.69.4 usage:
fortio command [flags] target
where command is one of: load (load testing), server (starts ui, rest api,
http-echo, redirect, proxies, tcp-echo, udp-echo and grpc ping servers),
tcp-echo (only the tcp-echo server), udp-echo (only udp-echo server),
report (report only UI server), redirect (only the redirect server),
proxies (only the -M and -P configured proxies), grpcping (gRPC client),
or curl (single URL debug), or nc (single tcp or udp:// connection),
or script (interactive grol script mode or script file),
or version (prints the full version and build details).
where target is a URL (http load tests) or host:port (grpc health test),
or tcp://host:port (tcp load test), or udp://host:port (udp load test).
or 1 of the special arguments
fortio {help|envhelp|version|buildinfo}
flags:
-H key:value
Additional HTTP header(s) or gRPC metadata. Multiple key:value pairs can be
passed using multiple -H.
-L Follow redirects (implies -std-client) - do not use for load test
-M value
HTTP multi proxy to run, e.g -M "localport1 baseDestURL1 baseDestURL2" -M ...
-P value
TCP proxies to run, e.g -P "localport1 dest_host1:dest_port1" -P "[::1]:0
www.google.com:443" ...
-X string
HTTP method to use instead of GET/POST depending on payload/content-type
-a Automatically save JSON result with filename based on labels & timestamp
-abort-on int
HTTP status code that if encountered aborts the run. e.g., 503 or -1 for socket
errors.
-access-log-file path
file path to log all requests to. Maybe have performance impacts
-access-log-format format
format for access log. Supported values: [json, influx] (default "json")
-allow-initial-errors
Allow and don't abort on initial warmup errors
-base-url URL
base URL used as prefix for data/index.tsv generation. (when empty, the URL from
the first request is used)
-c int
Number of connections/goroutine/threads (default 4)
-cacert Path
Path to a custom CA certificate file to be used for the TLS client connections,
if empty, use https:// prefix for standard internet/system CAs
-calc-qps
Calculate the qps based on number of requests (-n) and duration (-t)
-cert Path
Path to the certificate file to be used for client or server TLS
-compression
Enable HTTP compression
-config-dir directory
Config directory to watch for dynamic flag changes
-config-port port
Config port to open for dynamic flag UI/api
-connection-reuse min:max
Range min:max for the max number of connections to reuse for each thread, default
to unlimited. e.g. 10:30 means randomly choose a max connection reuse threshold between
10 and 30 requests.
-content-type string
Sets HTTP content type. Setting this value switches the request method from GET
to POST.
-curl
Just fetch the content once
-curl-stdout-headers
Restore pre 1.22 behavior where HTTP headers of the fast client are output to
stdout in curl mode. now stderr by default.
-data-dir Directory
Directory where JSON results are stored/read (default ".")
-dns-method method
When a name resolves to multiple ip, which method to pick: cached-rr for cached
round-robin, rnd for random, first for first answer (pre 1.30 behavior), rr for
round-robin. (default cached-rr)
-echo-debug-path URI
http echo server URI for debug, empty turns off that part (more secure) (default
"/debug")
-echo-server-default-params value
Default parameters/querystring to use if there isn't one provided explicitly. E.g
"status=404&delay=3s"
-gomaxprocs int
Setting for runtime.GOMAXPROCS, < 1 doesn't change the default
-grpc
Use gRPC (health check by default, add -ping for ping) for load testing
-grpc-compression
Enable gRPC compression
-grpc-max-streams uint
MaxConcurrentStreams for the gRPC server. Default (0) is to leave the option
unset.
-grpc-ping-delay duration
gRPC ping delay in response
-grpc-port port
grpc server port. Can be in the form of host:port, ip:port or port or
/unix/domain/path or "disabled" to not start the gRPC server. (default "8079")
-h2
Attempt to use HTTP/2.0 / h2 (instead of HTTP/1.1) for both TLS and h2c
-halfclose
When not keepalive, whether to half close the connection (only for fast http)
-health
gRPC ping client mode: use health instead of ping
-healthservice string
which service string to pass to health check
-http-port port
http-echo server port. Can be in the form of host:port, ip:port, port or
/unix/domain/path or "disabled". (default "8080")
-http1.0
Use HTTP/1.0 (instead of HTTP/1.1)
-httpbufferkb kbytes
Size of the buffer (max data size) for the optimized HTTP client in kbytes
(default 128)
-httpccch
Check for Connection: Close Header
-https-insecure
Long form of the -k flag
-init code
grol code to run before the script (for instance to set some arguments)
-jitter
set to true to de-synchronize parallel clients' by 10%
-json path
JSON output to provided file path or '-' for stdout (empty = no json output,
unless -a is used)
-k Do not verify certs in HTTPS/TLS/gRPC connections
-keepalive
Keep connection alive (only for fast HTTP/1.1) (default true)
-key Path
Path to the key file matching the -cert
-labels string
Additional config data/labels to add to the resulting JSON, defaults to target
URL and hostname
-log-errors
Log HTTP non-2xx/418 status codes as they occur (default true)
-logger-file-line
Filename and line numbers emitted in JSON logs, use -logger-file-line=false to
disable (default true)
-logger-force-color
Force color output even if stderr isn't a terminal
-logger-goroutine
GoroutineID emitted in JSON/color logs, use -logger-goroutine=false to disable
(default true)
-logger-json
Log in JSON format, use -logger-json=false to disable (default true)
-logger-no-color
Prevent colorized output even if stderr is a terminal
-logger-timestamp
Timestamps emitted in JSON logs, use -logger-timestamp=false to disable (default
true)
-loglevel level
log level, one of [Debug Verbose Info Warning Error Critical Fatal] (default Info)
-max-echo-delay value
Maximum sleep time for delay= echo server parameter. dynamic flag. (default 1.5s)
-maxpayloadsizekb Kbytes
MaxPayloadSize is the maximum size of payload to be generated by the EchoHandler
size= argument. In Kbytes. (default 256)
-mtls
Require client certificate signed by -cacert for client connections
-multi-mirror-origin
Mirror the request URL to the target for multi proxies (-M) (default true)
-multi-serial-mode
Multi server (-M) requests one at a time instead of parallel mode
-n int
Run for exactly this number of calls instead of duration. Default (0) is to use
duration (-t). Default is 1 when used as gRPC ping count.
-nc-dont-stop-on-eof
in netcat (nc) mode, don't abort as soon as remote side closes
-no-reresolve
Keep the initial DNS resolution and don't re-resolve when making new connections
(because of error or reuse limit reached)
-nocatchup
set to exact fixed qps and prevent fortio from trying to catchup when the target
fails to keep up temporarily
-offset duration
Offset of the histogram data
-p string
List of pXX to calculate (default "50,75,90,99,99.9")
-payload string
Payload string to send along
-payload-file path
File path to be use as payload (POST for HTTP), replaces -payload when set.
-payload-size int
Additional random payload size, replaces -payload when set > 0, must be smaller
than -maxpayloadsizekb. Setting this switches HTTP to POST.
-ping
gRPC load test: use ping instead of health
-pprof
Enable pprof HTTP endpoint in the Web UI handler server
-profile file
write .cpu and .mem profiles to file
-proxy-all-headers
Determines if only tracing or all headers (and cookies) are copied from request
on the fetch2 ui/server endpoint (default true)
-qps float
Queries Per Seconds or 0 for no wait/max qps (default 8)
-quiet
Quiet mode, sets loglevel to Error (quietly) to reduces the output
-r float
Resolution of the histogram lowest buckets in seconds (default 0.001)
-redirect-port port
Redirect all incoming traffic to https:// URL (need ingress to work properly).
Can be in the form of host:port, ip:port, port or "disabled" to disable the feature.
(default "8081")
-resolve IP
Resolve host name to this IP
-resolve-ip-type type
Resolve type: ip4 for ipv4, ip6 for ipv6 only, use ip for both (default ip4)
-runid int
Optional RunID to add to JSON result and auto save filename, to match server mode
-s int
Number of streams per gRPC connection (default 1)
-sequential-warmup
http(s) runner warmup done sequentially instead of parallel. When set, restores
pre 1.21 behavior
-server-idle-timeout value
Default IdleTimeout for servers (default 30s)
-static-dir path
Deprecated/unused path.
-stdclient
Use the slower net/http standard client (slower but supports h2/h2c)
-stream
Stream payload from stdin (only for fortio curl mode)
-sync URL
index.tsv or s3/gcs bucket XML URL to fetch at startup for server modes.
-sync-interval duration
Refresh the URL every given interval (default, no refresh)
-t duration
How long to run the test or 0 to run until ^C (default 5s)
-tcp-port port
tcp-echo server port. Can be in the form of host:port, ip:port, port or
/unix/domain/path or "disabled". (default "8078")
-timeout duration
Connection and read timeout value (for HTTP) (default 3s)
-udp-async
if true, udp echo server will use separate go routine to reply
-udp-port port
udp-echo server port. Can be in the form of host:port, ip:port, port or
"disabled". (default "8078")
-udp-timeout duration
Udp timeout (default 750ms)
-ui-path URI
HTTP server URI for UI, empty turns off that part (more secure) (default
"/fortio/")
-uniform
set to true to de-synchronize parallel clients' requests uniformly
-unix-socket path
Unix domain socket path to use for physical connection
-user user:password
User credentials for basic authentication (for HTTP). Input data format should be
user:password
See also the FAQ entry about [fortio flags for best results](https://github.com/fortio/fortio/wiki/FAQ#i-want-to-get-the-best-results-what-flags-should-i-pass).
## Server URLs and features
Fortio `server` has the following feature for the HTTP listening on 8080 (all paths and ports are configurable through flags above):
* A simple echo server which will echo back posted data (for any path not mentioned below).
For instance `curl -d abcdef http://localhost:8080/` returns `abcdef` back. It supports the following optional query argument parameters:
| Parameter | Usage, example |
|-----------|----------------|
| delay | duration to delay the response by. Can be a single value or a comma separated list of probabilities, e.g, `delay=150us:10,2ms:5,0.5s:1` for 10% of chance of a 150 us delay, 5% of a 2ms delay and 1% of a 1/2 second delay |
| status | HTTP status to return instead of 200. Can be a single value or a comma separated list of probabilities, e.g, `status=404:10,503:5,429:1` for 10% of chance of a 404 status, 5% of a 503 status and 1% of a 429 status |
| size | size of the payload to reply instead of echoing input. Also works as probabilities list. `size=1024:10,512:5` 10% of response will be 1k and 5% will be 512 bytes payload and the REST defaults to echoing back. |
| close | close the socket after answering e.g, `close=true` to close after all requests or `close=5.3` to close after approximately 5.3% of requests|
| header | header(s) to add to the reply e.g., `&header=Foo:Bar&header=X:Y` |
| gzip | If `Accept-Encoding: gzip` is passed in headers by the caller/client; and `gzip=true` is in the query args, all response will be gzipped; or if `gzip=42.7` is passed, approximately 42.7% will|
`delay`, `close` and `header` query arguments are also supported for the `debug` endpoint which echoes back the request (gzip is always done if `Accept-Encoding: gzip` is present, status is always 200, and the payload is the echo back debug information).
You can set a default value for all these by passing `-echo-server-default-params` to the server command line, for instance:
`fortio server -echo-server-default-params="delay=0.5s:50,1s:40&status=418"` will make the server respond with HTTP 418 and a delay of either 0.5s half of the time, 1s 40% and no delay in 10% of the calls; unless any `?` query args is passed by the client. Note that the quotes (") are for the shell to escape the ampersand (&) but should not be put in a YAML nor the dynamic flag URL for instance.
* `/debug` will echo back the request in plain text for human debugging.
* `/fortio/` A UI to
* Run/Trigger tests and graph the results.
* A UI to browse saved results and single graph or multi graph them (comparative graph of min, avg, median, p75, p99, p99.9 and max).
* Proxy/fetch other URLs.
* `/fortio/data/index.tsv` a tab separated value file conforming to Google cloud storage [URL list data transfer format](https://cloud.google.com/storage/transfer/create-url-list) so you can export/backup local results to the cloud.
* Download/sync peer to peer JSON results files from other Fortio servers (using their `index.tsv` URLs).
* Download/sync from an Amazon S3 or Google Cloud compatible bucket listings [XML URLs](https://docs.aws.amazon.com/AmazonS3/latest/API/RESTBucketGET.html).
* API to trigger and cancel runs from the running server (like the form UI, but more directly and with `async=on` option)
* `/fortio/rest/run` starts a run; the arguments are either from the command line or from POSTed JSON; `jsonPath` can be provided to look for in a subset of the JSON object, for instance `jsonPath=metadata` allows using the flagger webhook metadata for fortio run parameters (see [Remote Triggered load test section below](#remote-triggered-load-test-server-mode-rest-api)).
* `/fortio/rest/stop` stops all current run or by run ID (passing `runid=` query argument).
* `/fortio/rest/status` lists the current runs (or the options of a single one if `runid` is passed).
* DNS API for troubleshooting latency based records / view of the DNS where fortio server is running. `/fortio/rest/dns?name=x` resolves all the IPs for `x`.
The `report` mode is a read-only subset of the above directly on `/`.
There is also the gRPC health and ping servers, as well as the HTTP->HTTPS redirector.
## Example use and output
Note that recent versions of fortio, when run on the console, have colorized output (and JSON when ran in server environment). What's below is plain text from older versions.
### Start the internal servers
```Shell
$ fortio server &
Fortio X.Y.Z tcp-echo server listening on tcp [::]:8078
Fortio X.Y.Z udp-echo server listening on udp [::]:8078
Fortio X.Y.Z grpc 'ping' server listening on tcp [::]:8079
Fortio X.Y.Z https redirector server listening on tcp [::]:8081
Fortio X.Y.Z http-echo server listening on tcp [::]:8080
Data directory is /Users/ldemailly/dev/fortio
REST API on /fortio/rest/run, /fortio/rest/status, /fortio/rest/stop, /fortio/rest/dns
Debug endpoint on /debug, Additional Echo on /debug/echo/, Flags on /fortio/flags, and Metrics on /debug/metrics
UI started - visit:
http://localhost:8080/fortio/
(or any host/ip reachable on this server)
I fortio_main.go:285> Note: not using dynamic flag watching (use -config to set watch directory)
I fortio_main.go:293> All fortio X.Y.Z goM.m.p arm64 darwin servers started!
```
### Sample of the graphing UI
With the 2 histograms - total and errors overlaid:

### Change the port / binding address
By default, Fortio's web/echo servers listen on port 8080 on all interfaces.
Use the `-http-port` flag to change this behavior:
```Shell
$ fortio server -http-port 10.10.10.10:8088
UI starting - visit:
http://10.10.10.10:8088/fortio/
https redirector running on :8081
Fortio X.Y.Z grpc ping server listening on port :8079
Fortio X.Y.Z echo server listening on port 10.10.10.10:8088
```
### Unix domain sockets
You can use Unix domain socket for any server/client:
```Shell
$ fortio server --http-port /tmp/fortio-uds-http &
Fortio X.Y.Z grpc 'ping' server listening on [::]:8079
Fortio X.Y.Z https redirector server listening on [::]:8081
Fortio X.Y.Z echo server listening on /tmp/fortio-uds-http
UI started - visit:
fortio curl -unix-socket=/tmp/fortio-uds-http http://localhost/fortio/
14:58:45 I fortio_main.go:217> All fortio X.Y.Z unknown goM.m.p servers started!
$ fortio curl -unix-socket=/tmp/fortio-uds-http http://foo.bar/debug
15:00:48 I http_client.go:428> Using unix domain socket /tmp/fortio-uds-http instead of foo.bar http
HTTP/1.1 200 OK
Content-Type: text/plain; charset=UTF-8
Date: Wed, 08 Aug 2018 22:00:48 GMT
Content-Length: 231
Φορτίο version X.Y.Z unknown goM.m.p echo debug server up for 2m3.4s on ldemailly-macbookpro - request from
GET /debug HTTP/1.1
headers:
Host: foo.bar
User-Agent: fortio.org/fortio-X.Y.Z
body:
```
### TCP
Start the echo-server alone and run a load (use `tcp://` prefix for the load test to be for tcp echo server):
```Shell
$ fortio tcp-echo &
Fortio X.Y.Z tcp-echo TCP server listening on [::]:8078
19:45:30 I fortio_main.go:238> All fortio X.Y.Z release goM.m.p servers started!
$ fortio load -qps -1 -n 100000 tcp://localhost:8078
Fortio X.Y.Z running at -1 queries per second, 16->16 procs, for 100000 calls: tcp://localhost:8078
20:01:31 I tcprunner.go:218> Starting tcp test for tcp://localhost:8078 with 4 threads at -1.0 qps
Starting at max qps with 4 thread(s) [gomax 16] for exactly 100000 calls (25000 per thread + 0)
20:01:32 I periodic.go:558> T003 ended after 1.240585427s : 25000 calls. qps=20151.77629520873
20:01:32 I periodic.go:558> T002 ended after 1.241141084s : 25000 calls. qps=20142.75437521493
20:01:32 I periodic.go:558> T001 ended after 1.242066385s : 25000 calls. qps=20127.7486468648
20:01:32 I periodic.go:558> T000 ended after 1.24227731s : 25000 calls. qps=20124.331176909283
Ended after 1.242312567s : 100000 calls. qps=80495
Aggregated Function Time : count 100000 avg 4.9404876e-05 +/- 1.145e-05 min 2.7697e-05 max 0.000887051 sum 4.94048763
# range, mid point, percentile, count
>= 2.7697e-05 <= 0.000887051 , 0.000457374 , 100.00, 100000
# target 50% 0.00045737
# target 75% 0.00067221
# target 90% 0.000801115
# target 99% 0.000878457
# target 99.9% 0.000886192
Sockets used: 4 (for perfect no error run, would be 4)
Total Bytes sent: 2400000, received: 2400000
tcp OK : 100000 (100.0 %)
All done 100000 calls (plus 0 warmup) 0.049 ms avg, 80495.0 qps
```
### UDP
Start the udp-echo server alone and run a load (use `udp://` prefix for the load test to be for udp echo server):
```
$ fortio udp-echo &
Fortio X.Y.Z udp-echo UDP server listening on [::]:8078
21:54:52 I fortio_main.go:273> Note: not using dynamic flag watching (use -config to set watch directory)
21:54:52 I fortio_main.go:281> All fortio X.Y.Z release goM.m.p servers started!
$ fortio load -qps -1 -n 100000 udp://localhost:8078/
Fortio X.Y.Z running at -1 queries per second, 16->16 procs, for 100000 calls: udp://localhost:8078/
21:56:48 I udprunner.go:222> Starting udp test for udp://localhost:8078/ with 4 threads at -1.0 qps
Starting at max qps with 4 thread(s) [gomax 16] for exactly 100000 calls (25000 per thread + 0)
21:56:49 I periodic.go:558> T003 ended after 969.635695ms : 25000 calls. qps=25782.879208051432
21:56:49 I periodic.go:558> T000 ended after 969.906228ms : 25000 calls. qps=25775.687667818544
21:56:49 I periodic.go:558> T002 ended after 970.543935ms : 25000 calls. qps=25758.751457243405
21:56:49 I periodic.go:558> T001 ended after 970.737665ms : 25000 calls. qps=25753.610786287973
Ended after 970.755702ms : 100000 calls. qps=1.0301e+05
Aggregated Function Time : count 100000 avg 3.8532238e-05 +/- 1.7e-05 min 2.0053e-05 max 0.000881827 sum 3.85322376
# range, mid point, percentile, count
>= 2.0053e-05 <= 0.000881827 , 0.00045094 , 100.00, 100000
# target 50% 0.000450936
# target 75% 0.000666381
# target 90% 0.000795649
# target 99% 0.000873209
# target 99.9% 0.000880965
Sockets used: 4 (for perfect no error run, would be 4)
Total Bytes sent: 2400000, received: 2400000
udp OK : 100000 (100.0 %)
All done 100000 calls (plus 0 warmup) 0.039 ms avg, 103012.5 qps
```
### gRPC
#### Simple gRPC ping
```Shell
$ fortio grpcping -n 5 localhost
22:36:55 I pingsrv.go:150> Ping RTT 212000 (avg of 259000, 217000, 160000 ns) clock skew -10500
22:36:55 I pingsrv.go:150> Ping RTT 134333 (avg of 170000, 124000, 109000 ns) clock skew 5000
22:36:55 I pingsrv.go:150> Ping RTT 112000 (avg of 111000, 122000, 103000 ns) clock skew 5000
22:36:55 I pingsrv.go:150> Ping RTT 157000 (avg of 136000, 158000, 177000 ns) clock skew 6000
22:36:55 I pingsrv.go:150> Ping RTT 108333 (avg of 118000, 106000, 101000 ns) clock skew 1000
Clock skew histogram usec : count 5 avg 1.3 +/- 6.145 min -10.5 max 6 sum 6.5
# range, mid point, percentile, count
>= -10.5 <= -10 , -10.25 , 20.00, 1
> 0 <= 2 , 1 , 40.00, 1
> 4 <= 6 , 5 , 100.00, 3
# target 50% 4.33333
RTT histogram usec : count 15 avg 144.73333 +/- 44.48 min 101 max 259 sum 2171
# range, mid point, percentile, count
>= 101 <= 110 , 105.5 , 26.67, 4
> 110 <= 120 , 115 , 40.00, 2
> 120 <= 140 , 130 , 60.00, 3
> 140 <= 160 , 150 , 73.33, 2
> 160 <= 180 , 170 , 86.67, 2
> 200 <= 250 , 225 , 93.33, 1
> 250 <= 259 , 254.5 , 100.00, 1
# target 50% 130
```
#### Change the target port for gRPC
The value of `-grpc-port` (default 8079) is used when specifying a hostname or an IP address in `grpcping`. Add `:port` to the `grpcping` destination to
change this behavior:
```Shell
$ fortio grpcping 10.10.10.100:8078 # Connects to gRPC server 10.10.10.100 listening on port 8078
02:29:27 I pingsrv.go:116> Ping RTT 305334 (avg of 342970, 293515, 279517 ns) clock skew -2137
Clock skew histogram usec : count 1 avg -2.137 +/- 0 min -2.137 max -2.137 sum -2.137
# range, mid point, percentile, count
>= -4 < -2 , -3 , 100.00, 1
# target 50% -2.137
RTT histogram usec : count 3 avg 305.334 +/- 27.22 min 279.517 max 342.97 sum 916.002
# range, mid point, percentile, count
>= 250 < 300 , 275 , 66.67, 2
>= 300 < 350 , 325 , 100.00, 1
# target 50% 294.879
```
#### `grpcping` using TLS
Note that since 1.40 the same applies to the main HTTP server port, it will listen on TLS if `-cert` and `-key` flags are provided.
For testing use `make certs` to generate self signed test certificates.
* First, start Fortio server with the `-cert` and `-key` flags:
`/path/to/fortio/server.crt` and `/path/to/fortio/server.key` are paths to the TLS certificate and key that
you must provide:
```Shell
$ fortio server -cert /path/to/fortio/server.crt -key /path/to/fortio/server.key
UI starting - visit:
http://localhost:8080/fortio/
https redirector running on :8081
Fortio X.Y.Z grpc ping server listening on port :8079
Fortio X.Y.Z echo server listening on port localhost:8080
Using server certificate /path/to/fortio/server.crt to construct TLS credentials
Using server key /path/to/fortio/server.key to construct TLS credentials
```
* Next, use `grpcping` with the `-cacert` flag:
`/path/to/fortio/ca.crt` is the path to the CA certificate
that issued the server certificate for `localhost`. In our example, the server certificate is
`/path/to/fortio/server.crt`:
```Shell
$ fortio grpcping -cacert /path/to/fortio/ca.crt localhost
Using server certificate /path/to/fortio/ca.crt to construct TLS credentials
16:00:10 I pingsrv.go:129> Ping RTT 501452 (avg of 595441, 537088, 371828 ns) clock skew 31094
Clock skew histogram usec : count 1 avg 31.094 +/- 0 min 31.094 max 31.094 sum 31.094
# range, mid point, percentile, count
>= 31.094 <= 31.094 , 31.094 , 100.00, 1
# target 50% 31.094
RTT histogram usec : count 3 avg 501.45233 +/- 94.7 min 371.828 max 595.441 sum 1504.357
# range, mid point, percentile, count
>= 371.828 <= 400 , 385.914 , 33.33, 1
> 500 <= 595.441 , 547.721 , 100.00, 2
# target 50% 523.86
```
#### gRPC to standard HTTPS service
`grpcping` can connect to a non-fortio TLS server by prefacing the destination with `https://`:
```Shell
$ fortio grpcping https://grpc.fortio.org
13:48:20 I grpcrunner.go:276> stripping https scheme. grpc destination: grpc.fortio.org. grpc port: 443
13:48:26 I pingsrv.go:152> Ping RTT 63101562 (avg of 63577000, 63192688, 62535000 ns) clock skew 32021375
Clock skew histogram usec : count 1 avg 32021.375 +/- 0 min 32021.375 max 32021.375 sum 32021.375
# range, mid point, percentile, count
>= 32021.4 <= 32021.4 , 32021.4 , 100.00, 1
# target 50% 32021.4
RTT histogram usec : count 3 avg 63101.563 +/- 430.2 min 62535 max 63577 sum 189304.688
# range, mid point, percentile, count
>= 62535 <= 63577 , 63056 , 100.00, 3
# target 50% 62795.5
```
### Simple load test
Load (low default qps/threading) test:
```Shell
$ fortio load http://www.google.com
Fortio X.Y.Z running at 8 queries per second, 8->8 procs, for 5s: http://www.google.com
19:10:33 I httprunner.go:84> Starting http test for http://www.google.com with 4 threads at 8.0 qps
Starting at 8 qps with 4 thread(s) [gomax 8] for 5s : 10 calls each (total 40)
19:10:39 I periodic.go:314> T002 ended after 5.056753279s : 10 calls. qps=1.9775534712220633
19:10:39 I periodic.go:314> T001 ended after 5.058085991s : 10 calls. qps=1.9770324224999916
19:10:39 I periodic.go:314> T000 ended after 5.058796046s : 10 calls. qps=1.9767549252963101
19:10:39 I periodic.go:314> T003 ended after 5.059557593s : 10 calls. qps=1.9764573910247019
Ended after 5.059691387s : 40 calls. qps=7.9056
Sleep times : count 36 avg 0.49175757 +/- 0.007217 min 0.463508712 max 0.502087879 sum 17.7032725
Aggregated Function Time : count 40 avg 0.060587641 +/- 0.006564 min 0.052549016 max 0.089893269 sum 2.42350566
# range, mid point, percentile, count
>= 0.052549 < 0.06 , 0.0562745 , 47.50, 19
>= 0.06 < 0.07 , 0.065 , 92.50, 18
>= 0.07 < 0.08 , 0.075 , 97.50, 2
>= 0.08 <= 0.0898933 , 0.0849466 , 100.00, 1
# target 50% 0.0605556
# target 75% 0.0661111
# target 99% 0.085936
# target 99.9% 0.0894975
Code 200 : 40
Response Header Sizes : count 40 avg 690.475 +/- 15.77 min 592 max 693 sum 27619
Response Body/Total Sizes : count 40 avg 12565.2 +/- 301.9 min 12319 max 13665 sum 502608
All done 40 calls (plus 4 warmup) 60.588 ms avg, 7.9 qps
```
### Remote triggered load test (server mode REST API)
New since 1.18 the server has a `fortio/rest/run` endpoint similar to what the form UI submit in `fortio/` to start a run.
- plus `async` query arg or JSON value `"on"` will make the run asynchronous (returns just the runid of the run instead of waiting for the result);
- plus read all the run configuration from either query args or JSONPath POSTed info;
- compatible with [flagger](https://github.com/fluxcd/flagger) and other webhooks;
- New in 1.22: use `headers` JSON array to send headers (or multiple `&H=` query args).
Examples:
```shell
$ curl -v -d '{"metadata": {"url":"localhost:8080", "c":"1", "n":"1", "async":"on", "save":"on"}}' \
"localhost:8080/fortio/rest/run?jsonPath=.metadata"
{"started": 3}
```
makes a 1 connection 1 query run for localhost:8080 URL asynchronously and saves results
or minimally:
```shell
curl -s -d '{"url":"localhost:8080"}' "localhost:8080/fortio/rest/run" | jq
```
More complete example:
With sample.json (all values must be strings, even the numbers):
```json
{
"metadata": {
"url": "localhost:8080",
"payload": "foo",
"qps": "40",
"c": "2",
"t": "0.1s",
"headers": [
"Foo:Bar",
"X-Blah: Something else"
],
"save": "on"
}
}
```
You can run:
```shell
$ fortio curl -stdclient -payload-file sample.json "http://localhost:8080/fortio/rest/run?jsonPath=.metadata" > result.json
```
which makes requests like this:
```
POST / HTTP/1.1
Host: localhost:8080
Content-Length: 3
Content-Type: application/octet-stream
Foo: Bar
X-Blah: Something else
X-On-Behalf-Of: [::1]:62629
foo
```
and you get in result.json:
```json
{
"RunType": "HTTP",
"Labels": "",
"StartTime": "2022-03-19T15:34:23.279389-07:00",
"RequestedQPS": "40",
"RequestedDuration": "100ms",
"ActualQPS": 38.44836361217263,
"ActualDuration": 104035637,
"NumThreads": 2,
"Version": "X.Y.Z",
"DurationHistogram": {
"Count": 4,
"Min": 0.00027292,
"Max": 0.000930407,
"Sum": 0.002332047,
"Avg": 0.00058301175,
"StdDev": 0.00028491034912527755,
"Data": [
{
"Start": 0.00027292,
"End": 0.000930407,
"Percent": 100,
"Count": 4
}
],
"Percentiles": [
{
"Percentile": 50,
"Value": 0.0004920823333333334
},
{
"Percentile": 75,
"Value": 0.0007112446666666667
},
{
"Percentile": 90,
"Value": 0.0008427420666666666
},
{
"Percentile": 99,
"Value": 0.0009216405066666668
},
{
"Percentile": 99.9,
"Value": 0.0009295303506666667
}
]
},
"Exactly": 0,
"Jitter": false,
"Uniform": false,
"RunID": 7,
"AccessLoggerInfo": "",
"RetCodes": {
"200": 4
},
"URL": "http://localhost:8080",
"NumConnections": 1,
"Compression": false,
"DisableFastClient": false,
"HTTP10": false,
"DisableKeepAlive": false,
"AllowHalfClose": false,
"Insecure": false,
"FollowRedirects": false,
"CACert": "",
"Cert": "",
"Key": "",
"Resolve": "",
"HTTPReqTimeOut": 3000000000,
"UserCredentials": "",
"ContentType": "",
"Payload": "Zm9v",
"UnixDomainSocket": "",
"LogErrors": false,
"ID": 0,
"SequentialWarmup": false,
"Sizes": {
"Count": 4,
"Min": 118,
"Max": 118,
"Sum": 472,
"Avg": 118,
"StdDev": 0,
"Data": [
{
"Start": 118,
"End": 118,
"Percent": 100,
"Count": 4
}
],
"Percentiles": null
},
"HeaderSizes": {
"Count": 4,
"Min": 115,
"Max": 115,
"Sum": 460,
"Avg": 115,
"StdDev": 0,
"Data": [
{
"Start": 115,
"End": 115,
"Percent": 100,
"Count": 4
}
],
"Percentiles": null
},
"SocketCount": 2,
"AbortOn": 0
}
```
- There is also the `fortio/rest/stop` endpoint to stop a run by its id or all runs if not specified.
### DNS REST API example
```bash
$ curl -s localhost:8080/fortio/rest/dns?name=debug.fortio.org | jq
```
Returns
```json
{
"Name": "debug.fortio.org",
"IPv4": [
"18.222.136.83",
"192.9.142.5",
"192.9.227.83"
],
"IPv6": [
"2600:1f16:9c6:b400:282c:a766:6cab:4e82",
"2603:c024:c00a:d144:7cd0:4951:7106:96b8",
"2603:c024:c00a:d144:6663:5896:7efb:fbf3"
]
}
```
### GRPC load test
Uses `-s` to use multiple (h2/gRPC) streams per connection (`-c`), request to hit the fortio ping gRPC endpoint with a delay in replies of 0.25s and an extra payload for 10 bytes and auto save the JSON result:
```bash
$ fortio load -a -grpc -ping -grpc-ping-delay 0.25s -payload "01234567890" -c 2 -s 4 https://fortio-stage.istio.io
Fortio X.Y.Z running at 8 queries per second, 8->8 procs, for 5s: https://fortio-stage.istio.io
16:32:56 I grpcrunner.go:139> Starting GRPC Ping Delay=250ms PayloadLength=11 test for https://fortio-stage.istio.io with 4*2 threads at 8.0 qps
16:32:56 I grpcrunner.go:261> stripping https scheme. grpc destination: fortio-stage.istio.io. grpc port: 443
16:32:57 I grpcrunner.go:261> stripping https scheme. grpc destination: fortio-stage.istio.io. grpc port: 443
Starting at 8 qps with 8 thread(s) [gomax 8] for 5s : 5 calls each (total 40)
16:33:04 I periodic.go:533> T005 ended after 5.283227589s : 5 calls. qps=0.9463911814835126
[...]
Ended after 5.28514474s : 40 calls. qps=7.5684
Sleep times : count 32 avg 0.97034752 +/- 0.002338 min 0.967323561 max 0.974838789 sum 31.0511206
Aggregated Function Time : count 40 avg 0.27731944 +/- 0.001606 min 0.2741372 max 0.280604967 sum 11.0927778
# range, mid point, percentile, count
>= 0.274137 <= 0.280605 , 0.277371 , 100.00, 40
# target 50% 0.277288
# target 75% 0.278947
# target 90% 0.279942
# target 99% 0.280539
# target 99.9% 0.280598
Ping SERVING : 40
All done 40 calls (plus 2 warmup) 277.319 ms avg, 7.6 qps
Successfully wrote 1210 bytes of Json data to 2018-04-03-163258_fortio_stage_istio_io_ldemailly_macbookpro.json
```
And the JSON saved is
{
"RunType": "GRPC Ping Delay=250ms PayloadLength=11",
"Labels": "fortio-stage.istio.io , ldemailly-macbookpro",
"StartTime": "2018-04-03T16:32:58.895472681-07:00",
"RequestedQPS": "8",
"RequestedDuration": "5s",
"ActualQPS": 7.568383075162479,
"ActualDuration": 5285144740,
"NumThreads": 8,
"Version": "0.9.0",
"DurationHistogram": {
"Count": 40,
"Min": 0.2741372,
"Max": 0.280604967,
"Sum": 11.092777797,
"Avg": 0.277319444925,
"StdDev": 0.0016060870789948905,
"Data": [
{
"Start": 0.2741372,
"End": 0.280604967,
"Percent": 100,
"Count": 40
}
],
"Percentiles": [
{
"Percentile": 50,
"Value": 0.2772881634102564
},
{
"Percentile": 75,
"Value": 0.27894656520512817
},
{
"Percentile": 90,
"Value": 0.2799416062820513
},
{
"Percentile": 99,
"Value": 0.28053863092820513
},
{
"Percentile": 99.9,
"Value": 0.2805983333928205
}
]
},
"Exactly": 0,
"RetCodes": {
"1": 40
},
"Destination": "https://fortio-stage.istio.io",
"Streams": 4,
"Ping": true
}
* Load test using gRPC and TLS security. First, start Fortio server with the `-cert` and `-key` flags:
```Shell
fortio server -cert /etc/ssl/certs/server.crt -key /etc/ssl/certs/server.key
```
Next, run the `load` command with the `-cacert` flag:
```Shell
fortio load -cacert /etc/ssl/certs/ca.crt -grpc localhost:8079
```
### cURL like (single request) mode
```Shell
$ fortio load -curl -H Foo:Bar http://localhost:8080/debug
14:26:26 I http.go:133> Setting regular extra header Foo: Bar
HTTP/1.1 200 OK
Content-Type: text/plain; charset=UTF-8
Date: Mon, 08 Jan 2018 22:26:26 GMT
Content-Length: 230
Φορτίο version X.Y.Z echo debug server up for 39s on ldemailly-macbookpro - request from [::1]:65055
GET /debug HTTP/1.1
headers:
Host: localhost:8080
User-Agent: fortio.org/fortio-X.Y.Z
Foo: Bar
body:
```
Note: if you do not want the default fortio User-Agent to be sent pass `-H user-agent:`. If you want to send a present yet empty User-Agent: header, pass `-H "user-agent: "` (i.e., only whitespace sends empty one, empty value doesn't send any).
### Report only UI
If you have JSON files saved from running the full UI or downloaded, using the `-sync` option, from an Amazon or Google Cloud storage bucket or from a peer fortio server (to synchronize from a peer fortio, use `http://`_peer_`:8080/data/index.tsv` as the sync URL). You can then serve just the reports:
```Shell
$ fortio report -sync-interval 15m -sync "https://storage.googleapis.com/fortio-data?prefix=fortio.istio.io/"
Browse only UI starting - visit:
http://localhost:8080/
https redirector running on :8081
```
### Using the HTTP fan out / multi proxy feature
Example listen on 1 extra port and every request sent to that 1 port is forward to 2:
```Shell
# in one window or &
$ fortio server -M "5554 http://localhost:8080 http://localhost:8080"
[...]
Fortio X.Y.Z Multi on 5554 server listening on [::]:5554
10:09:56 I http_forwarder.go:152> Multi-server on [::]:5554 running with &{Targets:[{Destination:http://localhost:8080 MirrorOrigin:true} {Destination:http://localhost:8080 MirrorOrigin:true}] Name:Multi on [::]:5554 client:0xc0001ccc00}
```
Call the debug endpoint on both:
```Shell
# in new window
$ fortio curl -payload "a test" http://localhost:5554/debug
HTTP/1.1 200 OK
Date: Wed, 07 Oct 2020 17:11:06 GMT
Content-Length: 684
Content-Type: text/plain; charset=utf-8
Φορτίο version X.Y.Z unknown goM.m.p echo debug server up for 1m9.3s on C02C77BHMD6R - request from [::1]:51020
POST /debug HTTP/1.1
headers:
Host: localhost:8080
Accept-Encoding: gzip
Content-Type: application/octet-stream
User-Agent: fortio.org/fortio-X.Y.Z
X-Fortio-Multi-Id: 1
X-On-Behalf-Of: [::1]:51019
body:
a test
Φορτίο version X.Y.Z unknown goM.m.p echo debug server up for 1m9.3s on C02C77BHMD6R - request from [::1]:51020
POST /debug HTTP/1.1
headers:
Host: localhost:8080
Accept-Encoding: gzip
Content-Type: application/octet-stream
User-Agent: fortio.org/fortio-X.Y.Z
X-Fortio-Multi-Id: 2
X-On-Behalf-Of: [::1]:51019
body:
a test
```
There are 2 flags to further control the behavior of the multi-server proxies:
- pass `-mirrorOriginFlag=false` to not mirror all headers and request type to targets.
- pass `-multi-serial-mode` to stream request response serially instead of fetching in parallel and writing combined data after completion.
Also remember you can pass multiple `-M`.
### Using the TCP proxy server(s) feature
Example: open 2 additional listening ports and forward all requests received on 8888 and 8889 (IPv6) to 8080 (regular HTTP server)
```Shell
$ fortio server -P "8888 [::1]:8080" -P "[::1]:8889 [::1]:8080"
Fortio X.Y.Z grpc 'ping' server listening on [::]:8079
Fortio X.Y.Z https redirector server listening on [::]:8081
Fortio X.Y.Z echo server listening on [::]:8080
Data directory is /home/dl
UI started - visit:
http://localhost:8080/fortio/
(or any host/ip reachable on this server)
Fortio X.Y.Z proxy for [::1]:8080 server listening on [::]:8888
Fortio X.Y.Z proxy for [::1]:8080 server listening on [::1]:8889
```
## Implementation details
Fortio is written in the [Go](https://golang.org) language and includes a scalable semi log histogram in [stats.go](stats/stats.go) and a periodic runner engine in [periodic.go](periodic/periodic.go) with specializations for [HTTP](fhttp/httprunner.go) and [gRPC](fgrpc/grpcrunner.go).
The [fhttp/](fhttp/) package includes a very high performance specialized HTTP 1.1 client.
You may find fortio's [logger](log/logger.go) useful as well.
You can run the histogram code standalone as a command line in [histogram/](histogram/), a basic echo HTTP server in [echosrv/](echosrv/), or both the HTTP echo and gRPC ping server through `fortio server`, the fortio command line interface lives in this top level directory [main.go](main.go)
There is also [fcurl/](fcurl/) which is the `fortio curl` part of the code (if you need a light HTTP client without gRPC or server side).
A matching tiny (2Mb compressed) Docker image is [fortio/fortio.fcurl](https://hub.docker.com/r/fortio/fortio.fcurl/tags/).
## More examples
You can get the data on the console, for instance, with 5k qps: (includes envoy and mixer in the calls)
$ time fortio load -qps 5000 -t 60s -c 8 -r 0.0001 -H "Host: perf-cluster" http://benchmark-2:9090/echo
2017/07/09 02:31:05 Will be setting special Host header to perf-cluster
Fortio running at 5000 queries per second for 1m0s: http://benchmark-2:9090/echo
Starting at 5000 qps with 8 thread(s) [gomax 4] for 1m0s : 37500 calls each (total 300000)
2017/07/09 02:32:05 T004 ended after 1m0.000907812s : 37500 calls. qps=624.9905437680746
2017/07/09 02:32:05 T000 ended after 1m0.000922222s : 37500 calls. qps=624.9903936684861
2017/07/09 02:32:05 T005 ended after 1m0.00094454s : 37500 calls. qps=624.9901611965524
2017/07/09 02:32:05 T006 ended after 1m0.000944816s : 37500 calls. qps=624.9901583216429
2017/07/09 02:32:05 T001 ended after 1m0.00102094s : 37500 calls. qps=624.9893653892883
2017/07/09 02:32:05 T007 ended after 1m0.001096292s : 37500 calls. qps=624.9885805003184
2017/07/09 02:32:05 T003 ended after 1m0.001045342s : 37500 calls. qps=624.9891112105419
2017/07/09 02:32:05 T002 ended after 1m0.001044416s : 37500 calls. qps=624.9891208560392
Ended after 1m0.00112695s : 300000 calls. qps=4999.9
Aggregated Sleep Time : count 299992 avg 8.8889218e-05 +/- 0.002326 min -0.03490402 max 0.001006041 sum 26.6660543
# range, mid point, percentile, count
< 0 , 0 , 8.58, 25726
>= 0 < 0.001 , 0.0005 , 100.00, 274265
>= 0.001 < 0.002 , 0.0015 , 100.00, 1
# target 50% 0.000453102
WARNING 8.58% of sleep were falling behind
Aggregated Function Time : count 300000 avg 0.00094608764 +/- 0.0007901 min 0.000510522 max 0.029267604 sum 283.826292
# range, mid point, percentile, count
>= 0.0005 < 0.0006 , 0.00055 , 0.15, 456
>= 0.0006 < 0.0007 , 0.00065 , 3.25, 9295
>= 0.0007 < 0.0008 , 0.00075 , 24.23, 62926
>= 0.0008 < 0.0009 , 0.00085 , 62.73, 115519
>= 0.0009 < 0.001 , 0.00095 , 85.68, 68854
>= 0.001 < 0.0011 , 0.00105 , 93.11, 22293
>= 0.0011 < 0.0012 , 0.00115 , 95.38, 6792
>= 0.0012 < 0.0014 , 0.0013 , 97.18, 5404
>= 0.0014 < 0.0016 , 0.0015 , 97.94, 2275
>= 0.0016 < 0.0018 , 0.0017 , 98.34, 1198
>= 0.0018 < 0.002 , 0.0019 , 98.60, 775
>= 0.002 < 0.0025 , 0.00225 , 98.98, 1161
>= 0.0025 < 0.003 , 0.00275 , 99.21, 671
>= 0.003 < 0.0035 , 0.00325 , 99.36, 449
>= 0.0035 < 0.004 , 0.00375 , 99.47, 351
>= 0.004 < 0.0045 , 0.00425 , 99.57, 290
>= 0.0045 < 0.005 , 0.00475 , 99.66, 280
>= 0.005 < 0.006 , 0.0055 , 99.79, 380
>= 0.006 < 0.007 , 0.0065 , 99.82, 92
>= 0.007 < 0.008 , 0.0075 , 99.83, 15
>= 0.008 < 0.009 , 0.0085 , 99.83, 5
>= 0.009 < 0.01 , 0.0095 , 99.83, 1
>= 0.01 < 0.012 , 0.011 , 99.83, 8
>= 0.012 < 0.014 , 0.013 , 99.84, 35
>= 0.014 < 0.016 , 0.015 , 99.92, 231
>= 0.016 < 0.018 , 0.017 , 99.94, 65
>= 0.018 < 0.02 , 0.019 , 99.95, 26
>= 0.02 < 0.025 , 0.0225 , 100.00, 139
>= 0.025 < 0.03 , 0.0275 , 100.00, 14
# target 50% 0.000866935
# target 75% 0.000953452
# target 99% 0.00253875
# target 99.9% 0.0155152
Code 200 : 300000
Response Body Sizes : count 300000 avg 0 +/- 0 min 0 max 0 sum 0
Or you can get the data in [JSON format](https://github.com/fortio/fortio/wiki/Sample-JSON-output) (using `-json result.json`).
### Web/Graphical UI
Or graphically (through the [http://localhost:8080/fortio/](http://localhost:8080/fortio/) web UI):
Simple form/UI:
Sample requests with responses delayed by 250us and 0.5% of 503 and 1.5% of 429 simulated HTTP errors:

Run result:
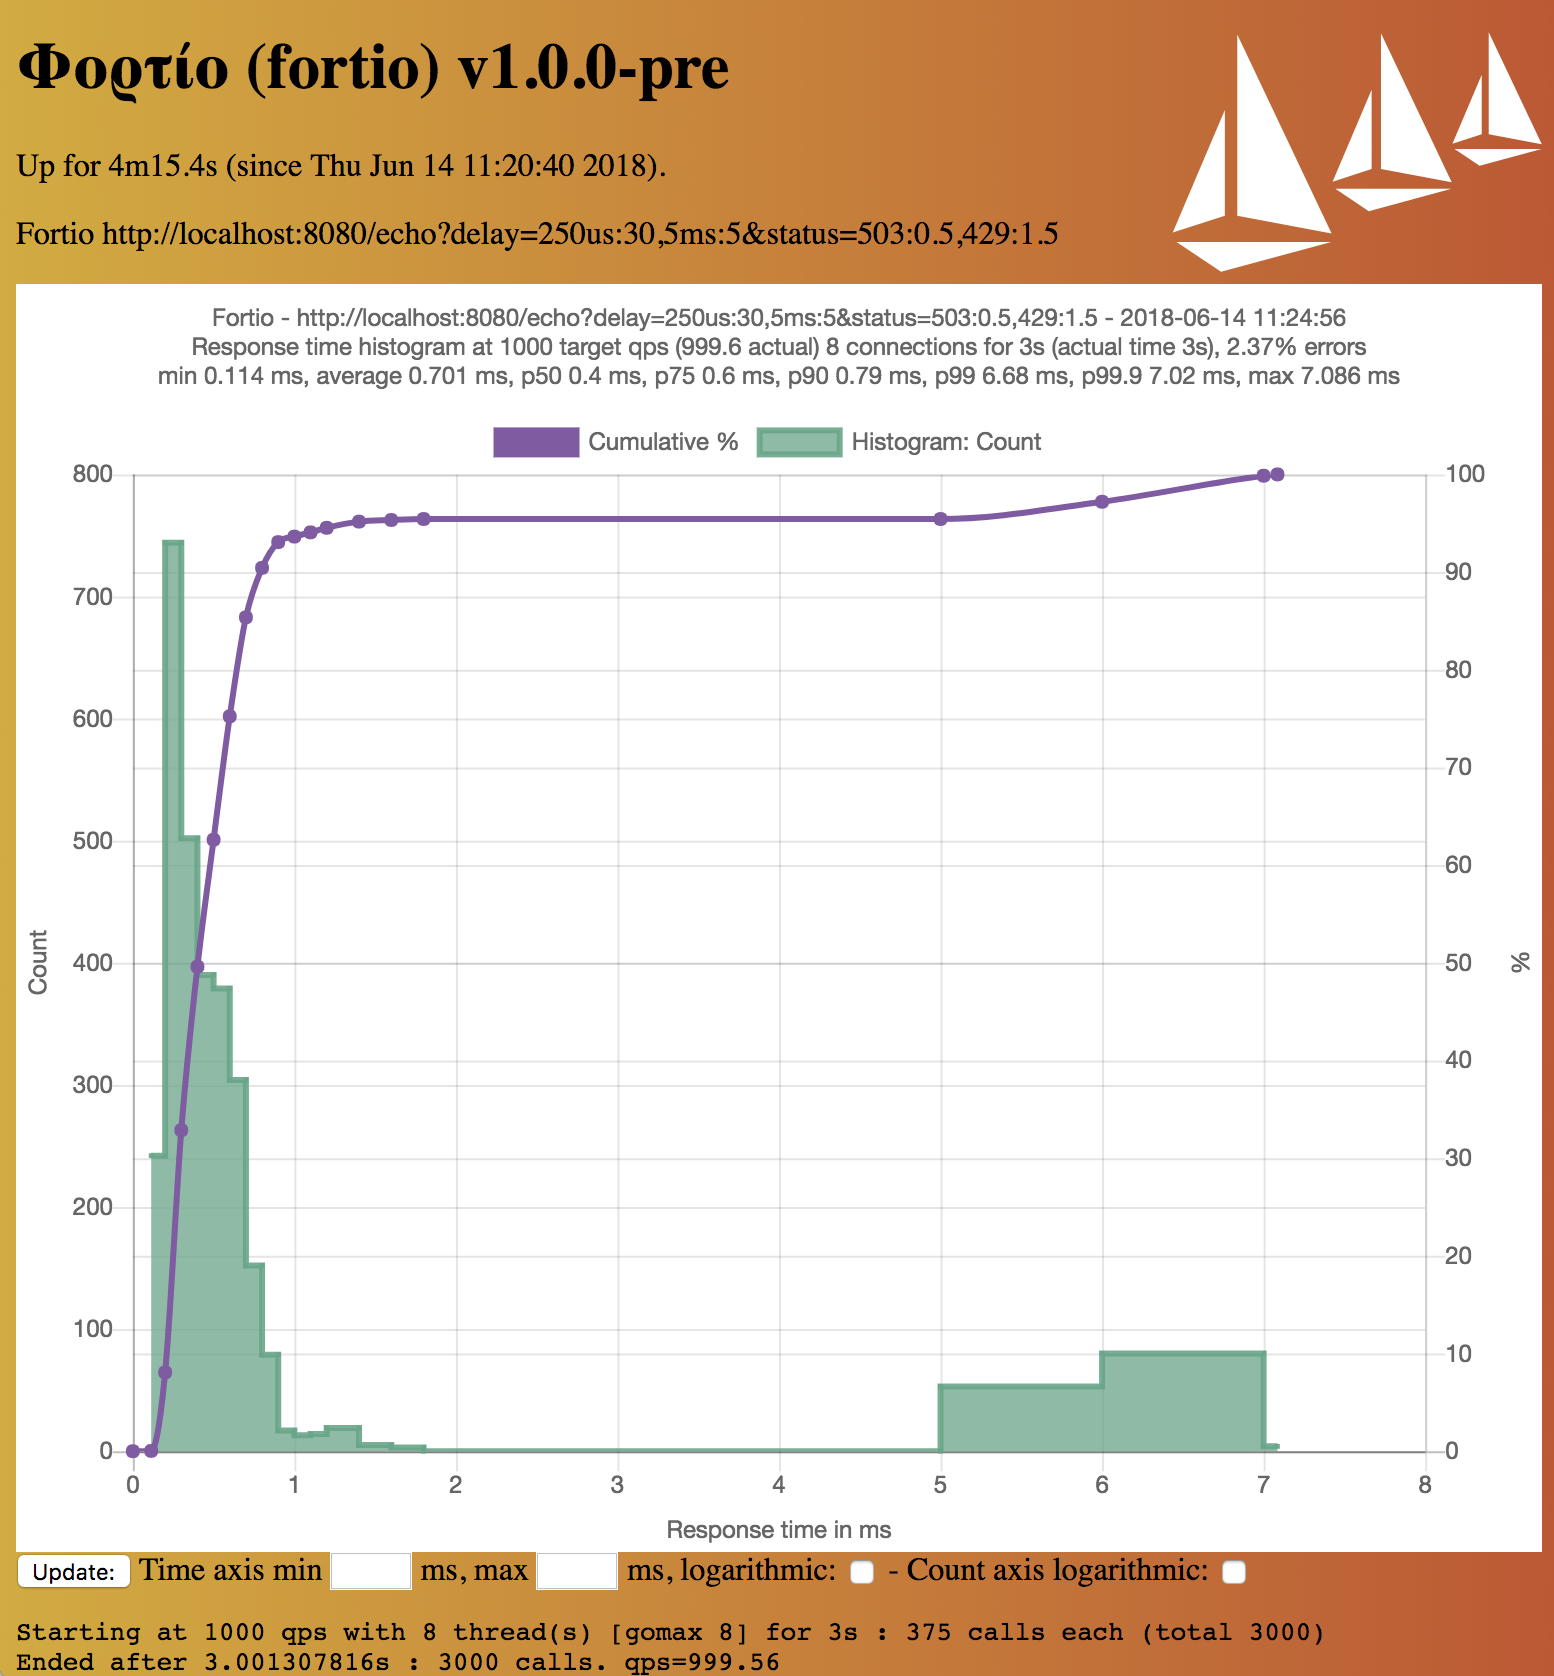
```Shell
Code 200 : 2929 (97.6 %)
Code 429 : 56 (1.9 %)
Code 503 : 15 (0.5 %)
```
There are live examples on [https://demo.fortio.org](https://demo.fortio.org/)
## Contributing
Contributions whether through issues, documentation, bug fixes, or new features
are most welcome !
Please also see [Contributing to Istio](https://github.com/istio/community/blob/master/CONTRIBUTING.md#contributing-to-istio)
and [Getting started contributing to Fortio](https://github.com/fortio/fortio/wiki/FAQ#how-do-i-get-started-contributing-to-fortio) in the FAQ.
If you are not using the binary releases, please do `make pull` to pull/update to the latest of the current branch.
And make sure to go strict format (`go get mvdan.cc/gofumpt` and `gofumpt -w *.go`) and run those commands successfully before sending your PRs:
```Shell
make test
make lint
make release-test
```
When modifying JavaScript, check with [standard](https://github.com/standard/standard):
```Shell
standard --fix ui/static/js/fortio_chart.js
```
New features and bug fixes should include a test.
## See also
Our wiki and the [Fortio FAQ](https://github.com/fortio/fortio/wiki/FAQ) (including for instance differences between `fortio` and `wrk` or `httpbin`).
Fortio is also used by, among others, [Meshery](https://docs.meshery.io/extensibility/load-generators).
## Disclaimer
This is not an officially supported Google product.